One Solid Year - Year in life of Brisbane Solid State Radar
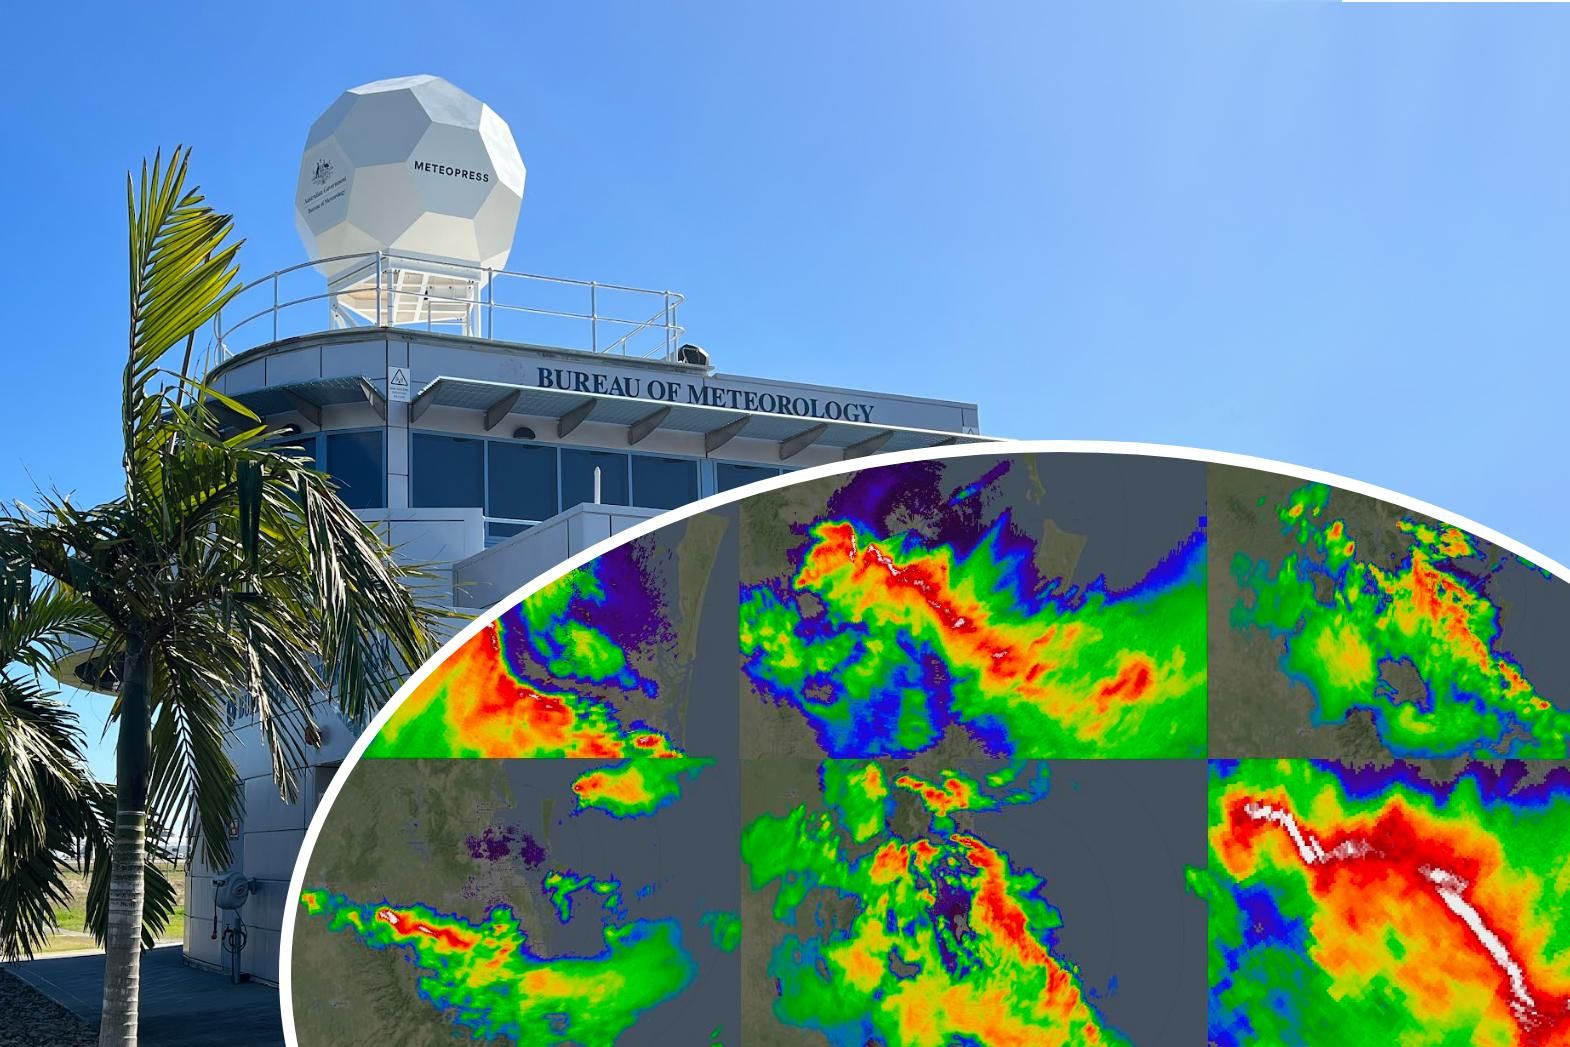
Installed in the summer of 2022, the new solid-state weather radar has been operational since its rapid deployment. Over the past year, the radar has recorded a variety of noteworthy weather situations, enriching the understanding of local weather patterns. Serving as a reliable backup for the Mt Stapylton radar, the Brisbane Airport radar has ensured consistent and uninterrupted weather measurements. This article aims to highlight some of the most interesting meteorological events captured by the radar during its first year of operation.
The radar is a Meteopress Solid-State C-band model with a 2.4 m diameter antenna (1.7° beam width) and a 2.4 kW solid-state power amplifier. It is operated by the Australian Bureau of Meteorology and is located on the Bureau's building, adjacent to Brisbane Airport. The installation took place on July 29, 2022, and this report was created on September 7, 2023, after one year of service.
Squall lines
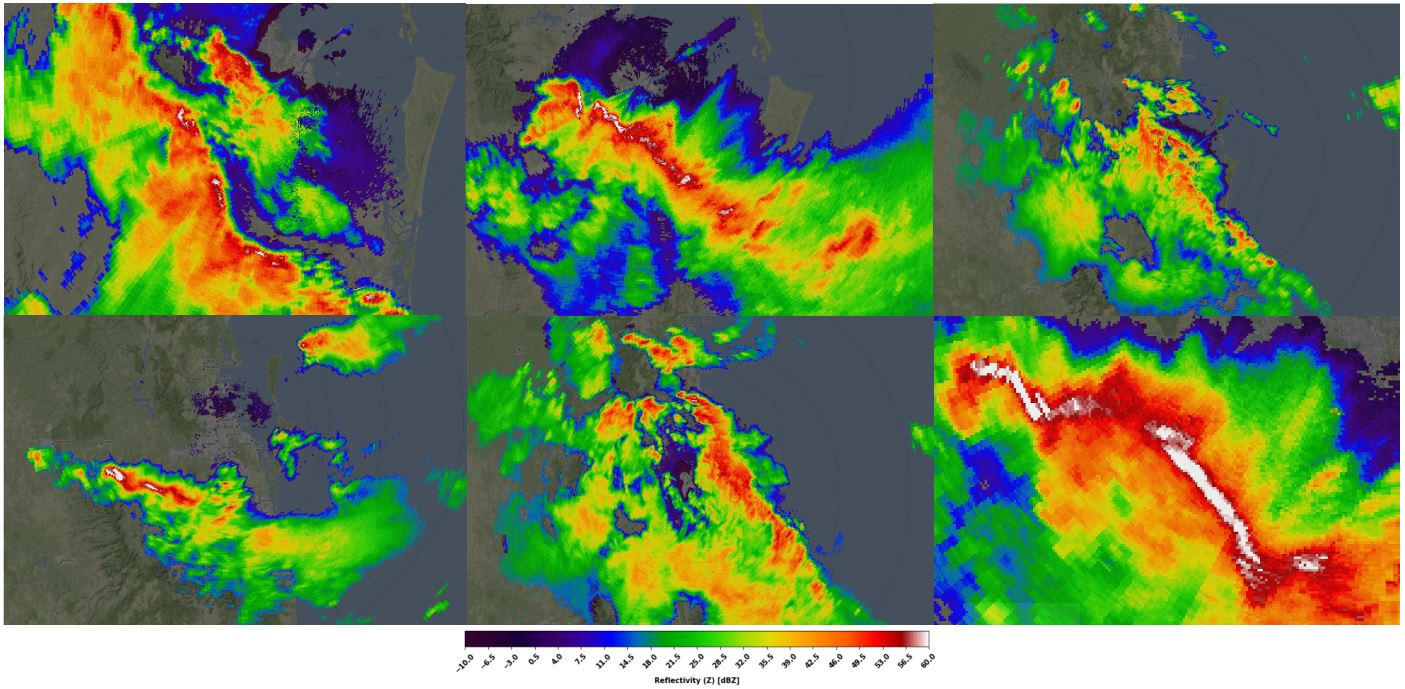
Squall lines are narrow, elongated bands of intense thunderstorms that form along or ahead of a cold front or in other weather-related scenarios. These meteorological phenomena are characterized by a linear arrangement of thunderstorms that can extend for hundreds of miles. Squall lines typically feature severe weather elements such as strong winds, heavy rainfall, hail, lightning, and sometimes tornadoes. In radar data, squall lines are well visible in basically all products as a line with different values. In doppler velocity, strong convergence is visible.
Mesovortices
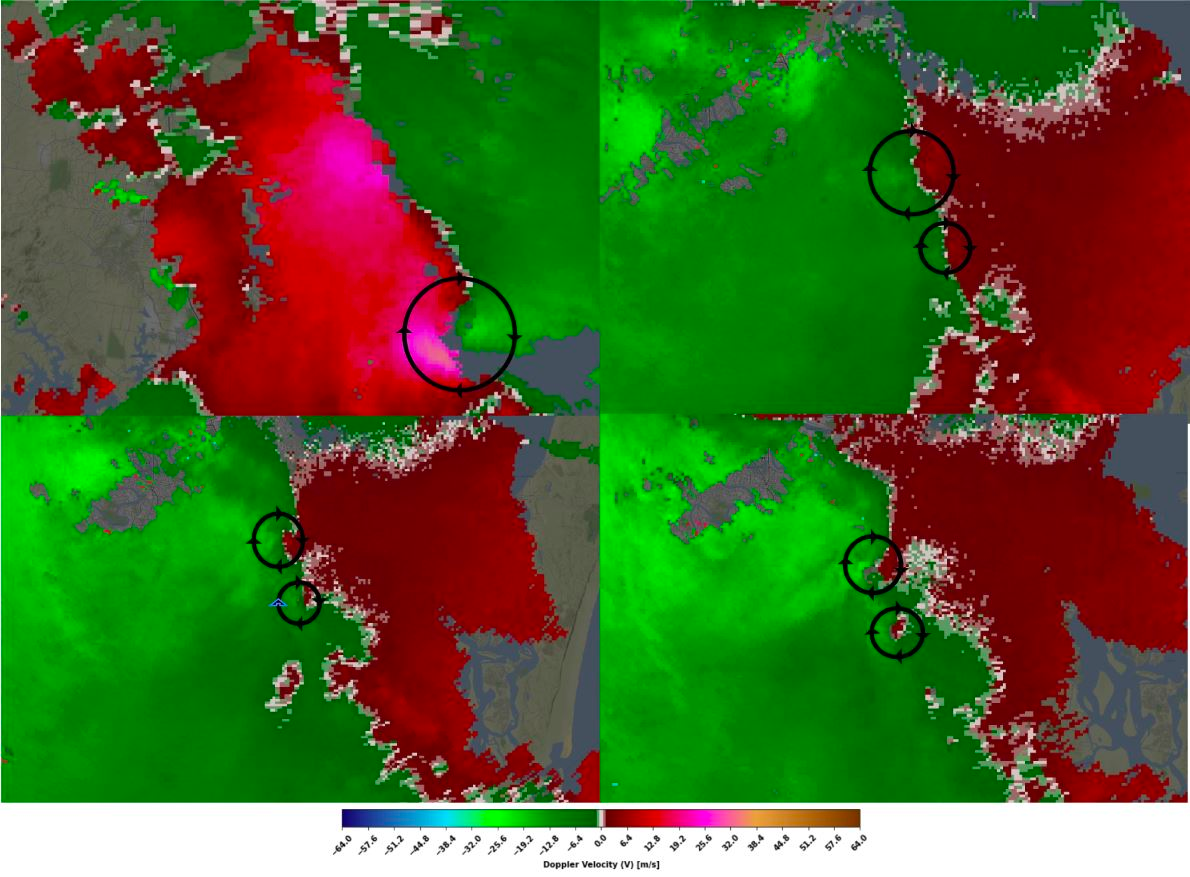
Mesovortices are small-scale, rotating air circulations within larger weather systems, often found along the squall lines. These swirling vortexes are typically a few miles in diameter and can develop rapidly within a storm. Mesovortices can be responsible for the formation of tornadoes.
Supercells
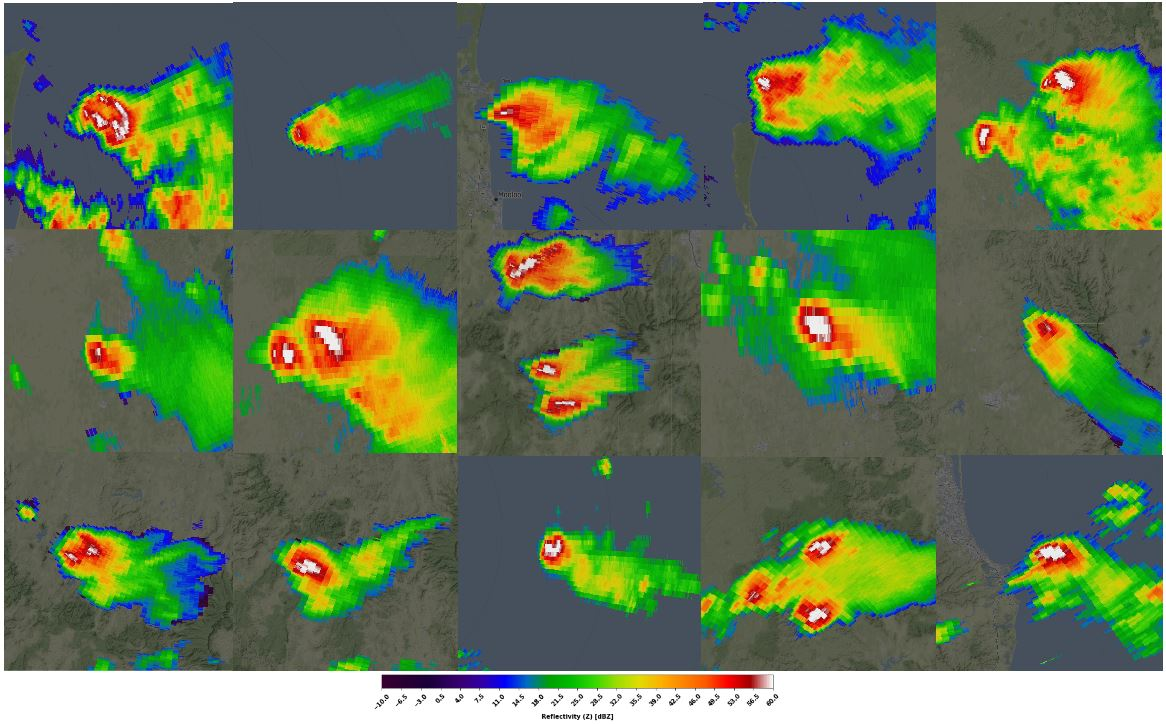
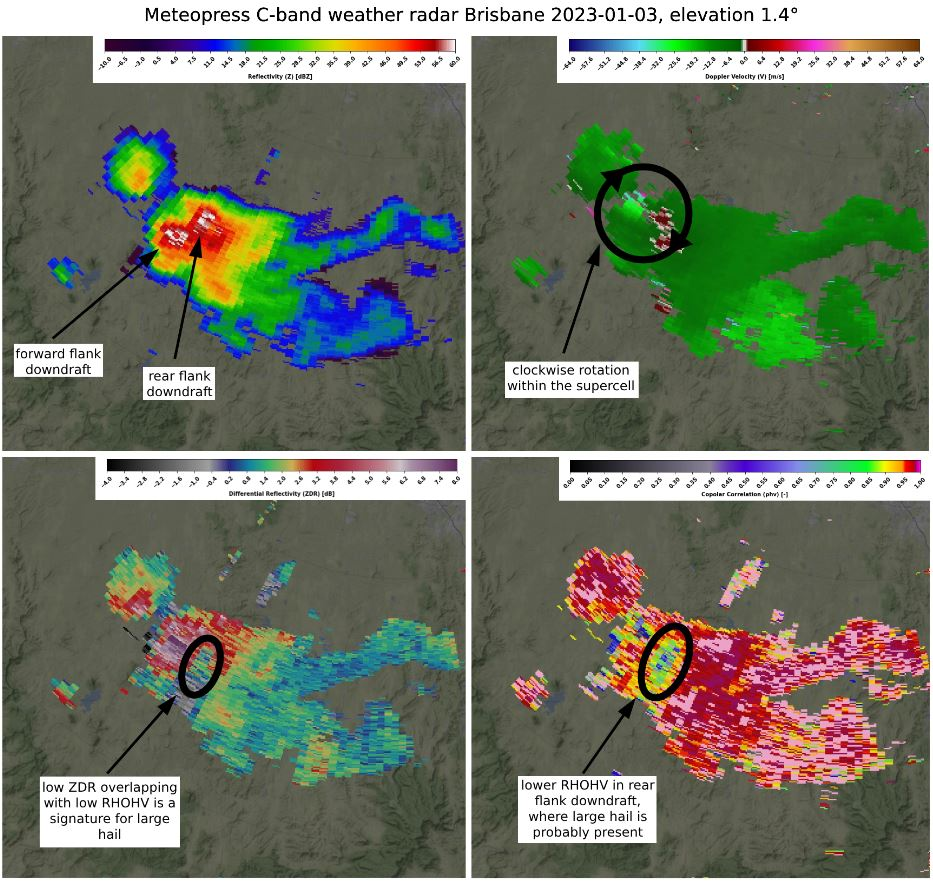
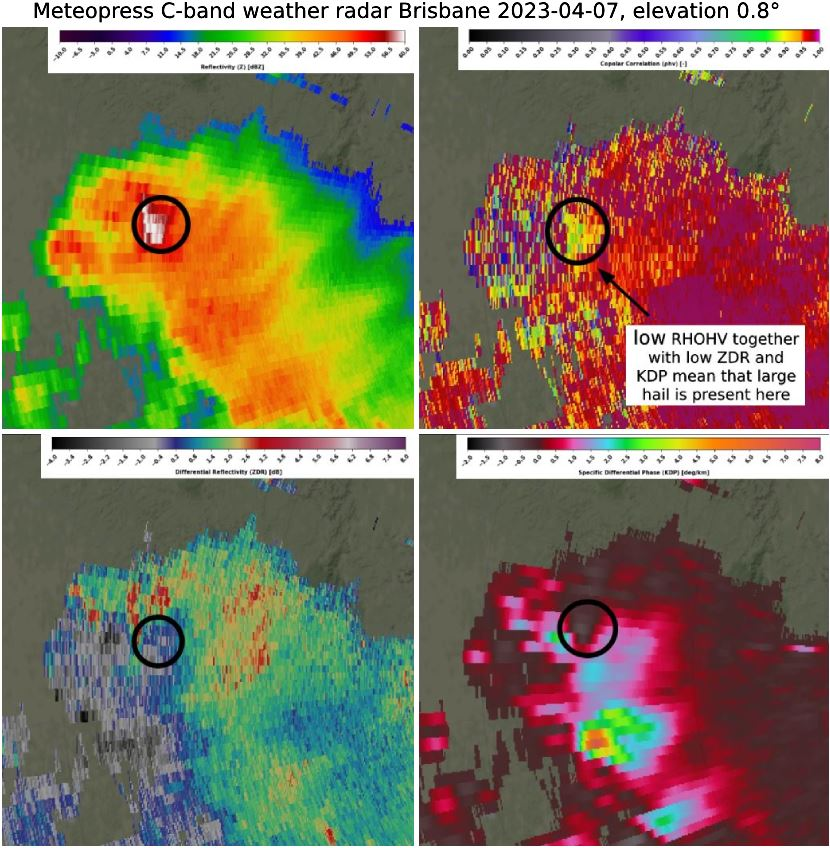
Supercells are strong storms with rotating updraft (mesocyclone). These storms are often accompanied by big hail, strong winds and sometimes even tornadoes. Supercells tend to have specific characteristics on radar products. Rotation can be visible in doppler velocity data, where significant differences in radial speeds are present. Big hail is characterized by lower ZDR and correlation coefficient values in radar images. Strong and big tornadoes can also be seen at doppler velocity data and it would be similar to the supercells, although differences in speed would be much higher and its area smaller. Also debris can be seen as areas of very low RHOHV.
Typical characteristics of a supercell on radar data
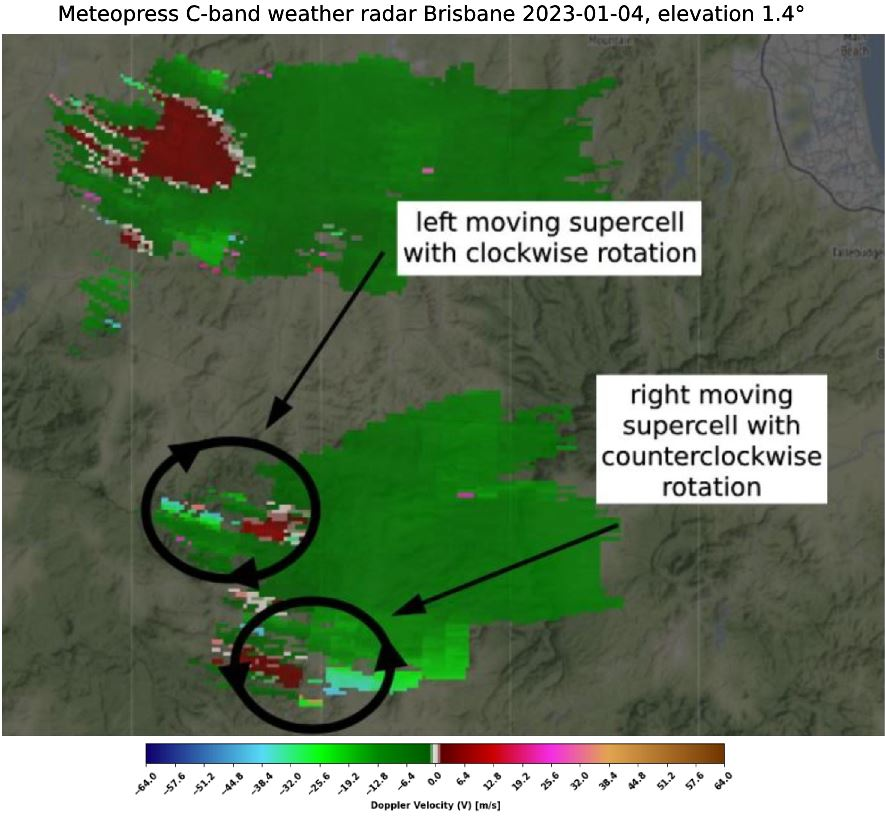
Supercell splitting
Supercells need strong vertical wind shear to form. Sometimes, when wind shear is high, but the direction of wind does not change or changes little with height, supercells can split into 2 storms. One moving left with clockwise rotation, the other one moving to the right with counterclockwise rotation. In the northern hemisphere, the left moving supercell is usually a bit weaker and has a longer duration. In the southern hemisphere it is opposite. In the case below, splitting occurs only 30 minutes after the storm began to form. Left moving supercell then continues to the northeast, the right moving one to the east. Left moving storm starts to weaken earlier in this case, while the other one retains its strength. From doppler velocity data, we can see 2 different mesocyclones, each one of them spinning in a different direction.
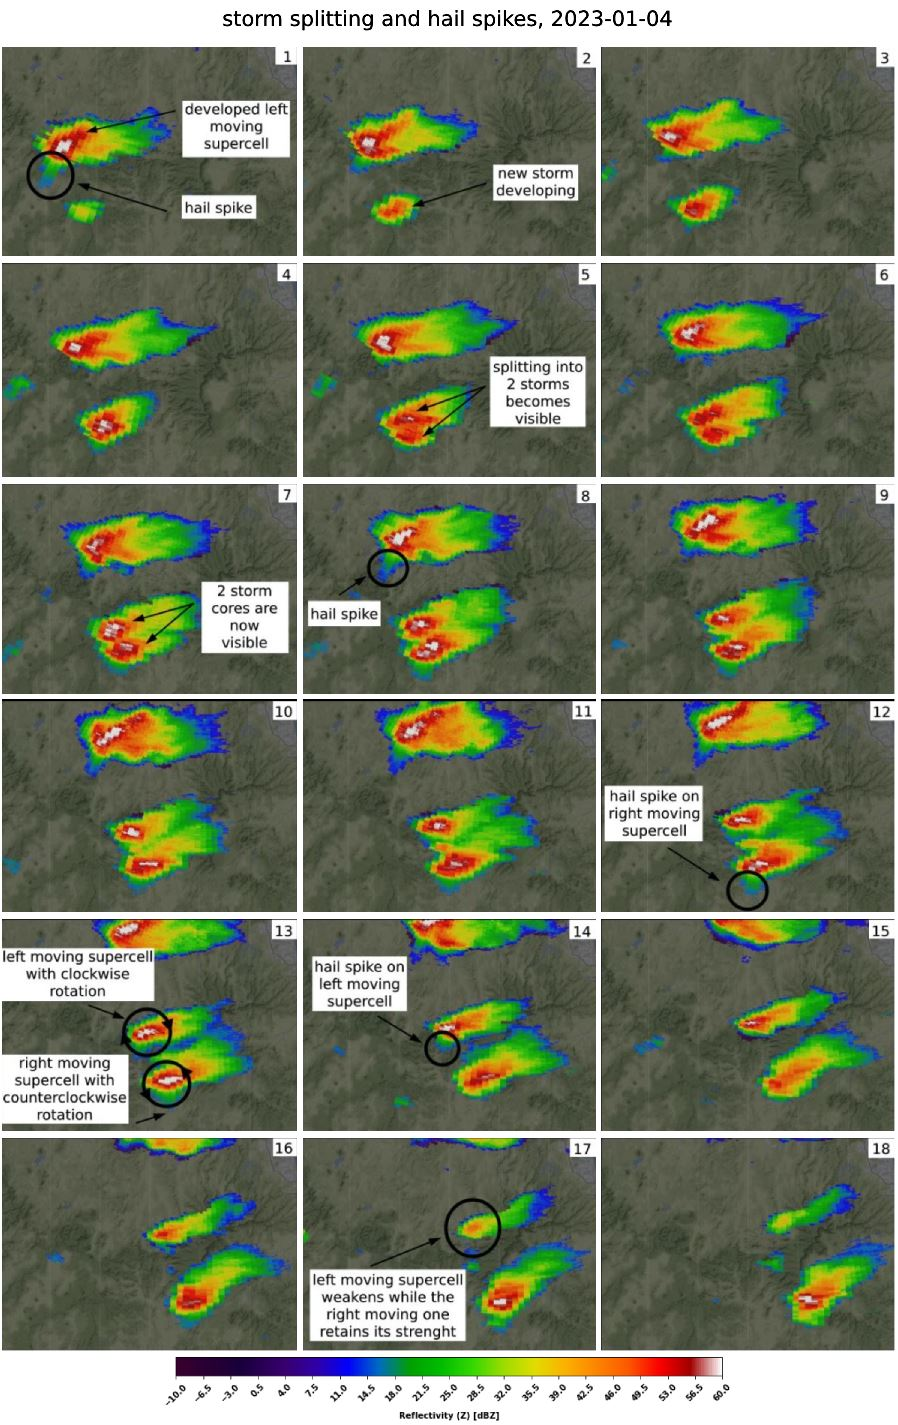
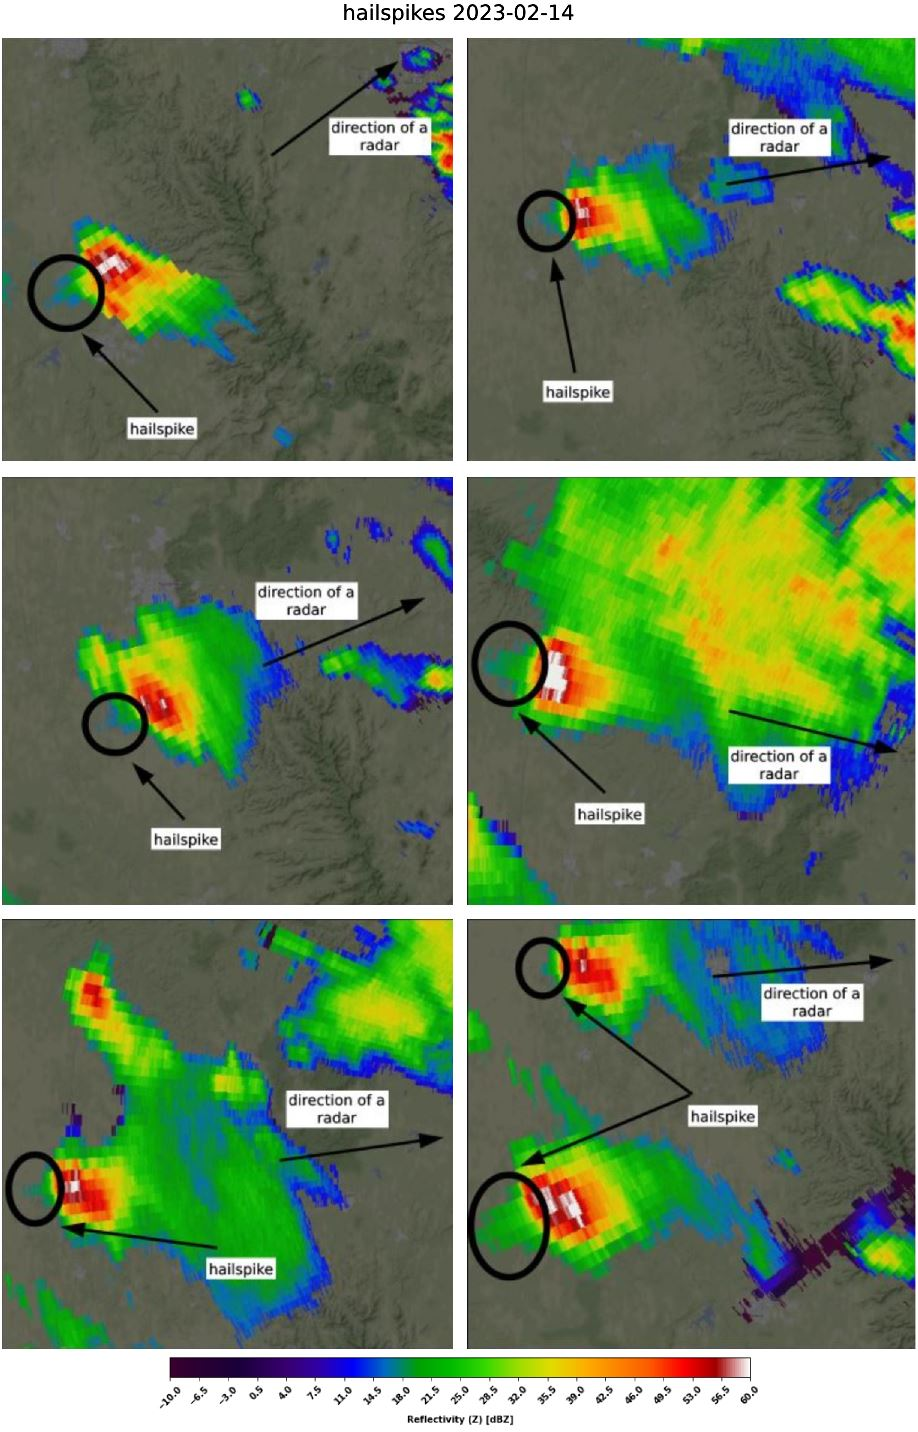
Hailspikes
When a storm contains big hail, desired artifacts behind the storm in a direction from the radar can occur if the diameter of hailstones is close to the wavelength of a signal from the radar due to Mie scattering. Wave then partially bounces from hailstones to the ground, back to the cloud and to the radar again. Radar then thinks that there are targets behind the storm, because the signal arrived later. Hail spikes are often filtered, but are important for identifying large hail.
Heavy precipitation
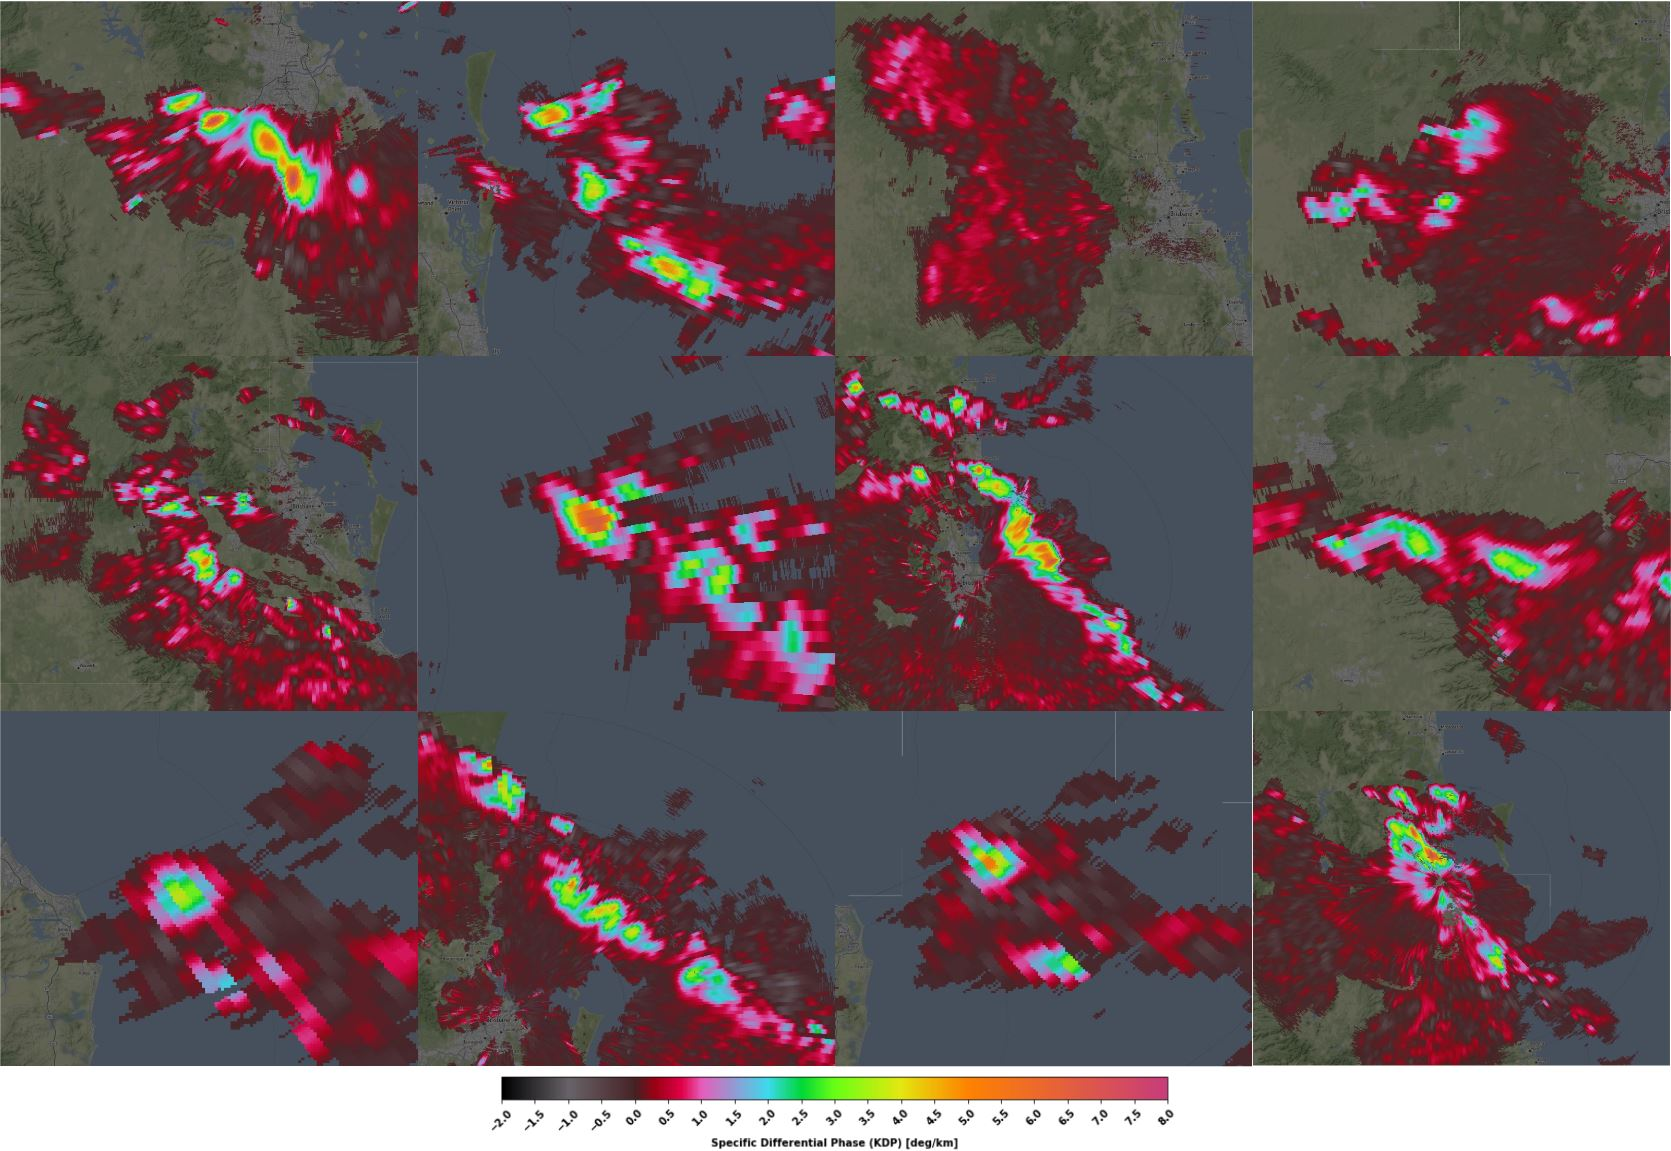
High KDP values are a good indicator of heavy precipitation. Usually even better than reflectivity, as KDP is not affected by attenuation. KDP is used in QPE algorithms, often in combination with reflectivity.
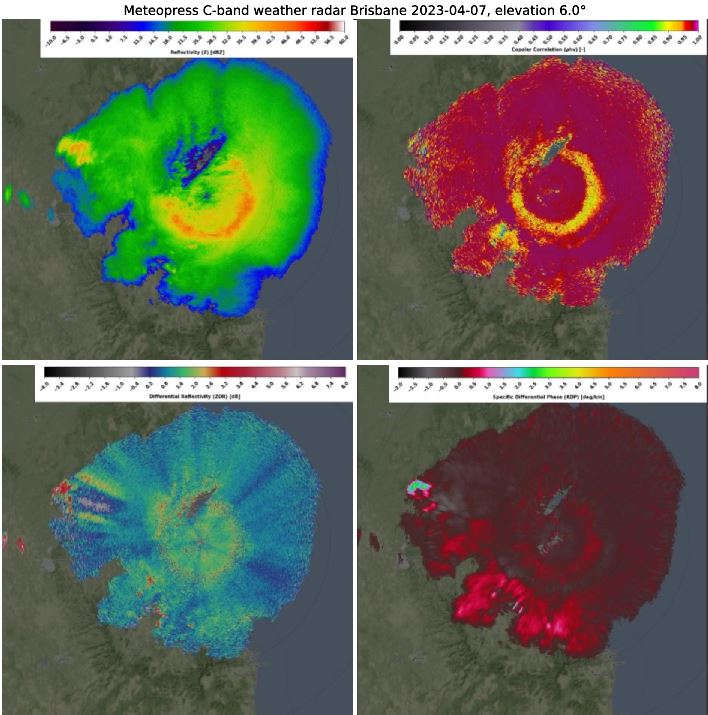
Melting layer and stratiform precipitation
Especially when measuring at higher elevations, we can recognize an area where snow melts and becomes rain from various radar products. Because each melting snowflake has different sizes and shapes, we see a drop in RHOHV values where melting occurs. Also ZDR is a bit higher and noisy due to water coated snowflakes being larger and mostly having the shape of a large raindrop. Higher reflectivity values are also present because of water coated snowflakes or hail being the most reflective. Area with these characteristics is visible in the form of a band around the radar and thus is often called a brightband.
Melting layer dual pol. moments
Melting layer is visible in the form of a band around the radar with different values of reflectivity, RHOHV, ZDR and KDP. Typical signs are: higher reflectivity values due to rain coated snow being highly reflective, higher and noisy ZDR values, low RHOHV because of different sizes and shapes of targets and slightly higher KDP values.
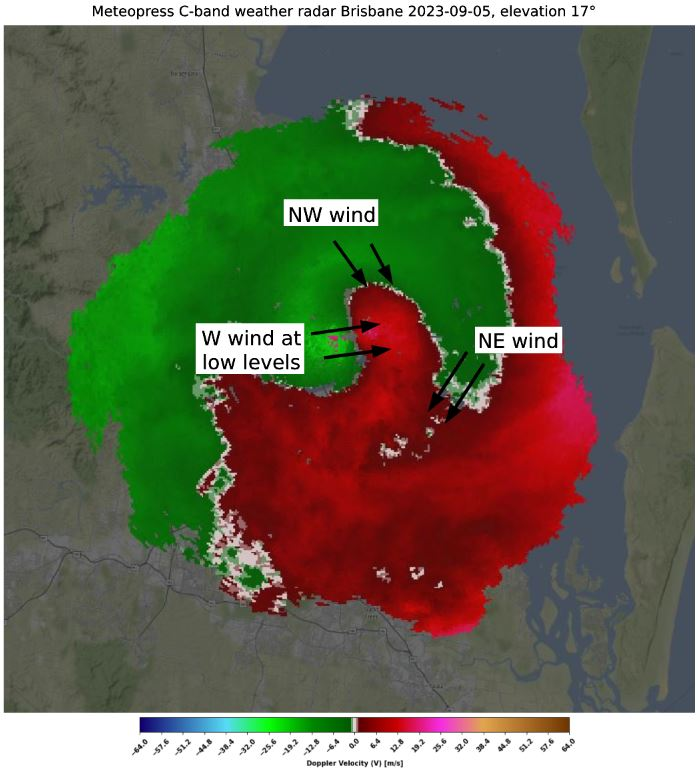
Significant horizontal or vertical wind shear
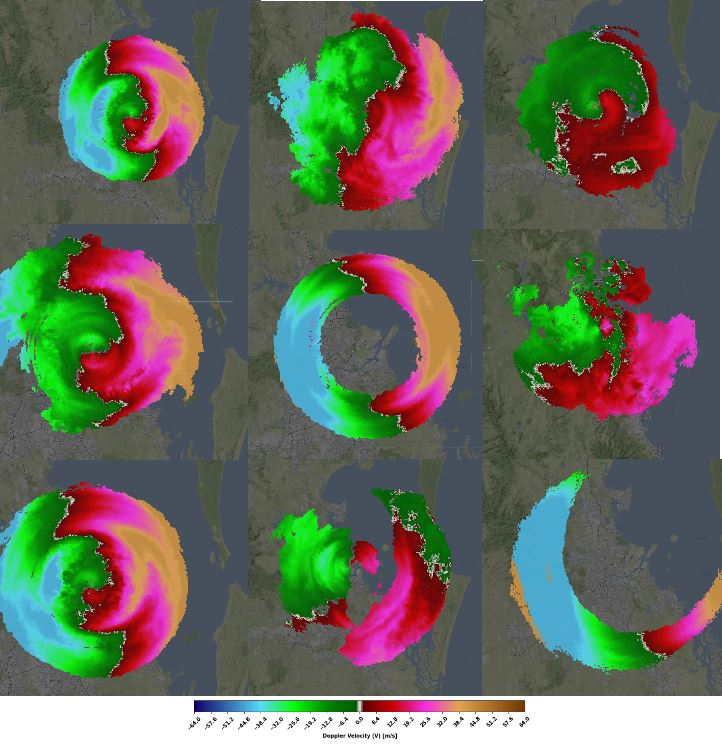
Doppler velocity data at higher elevation allow us to see how the direction and speed of wind is changing with altitude. This often creates beautiful red and green pictures just as seen in the picture below. Because radar is transmitting at a higher angle, areas farther from the radar site are in reality higher than places close to a radar and differences in wind directions are more common than in the CAPPI visualizations (values at fixed altitude). Here, the wind blows from the east at lower altitudes but changes its direction to NNW at higher altitudes.
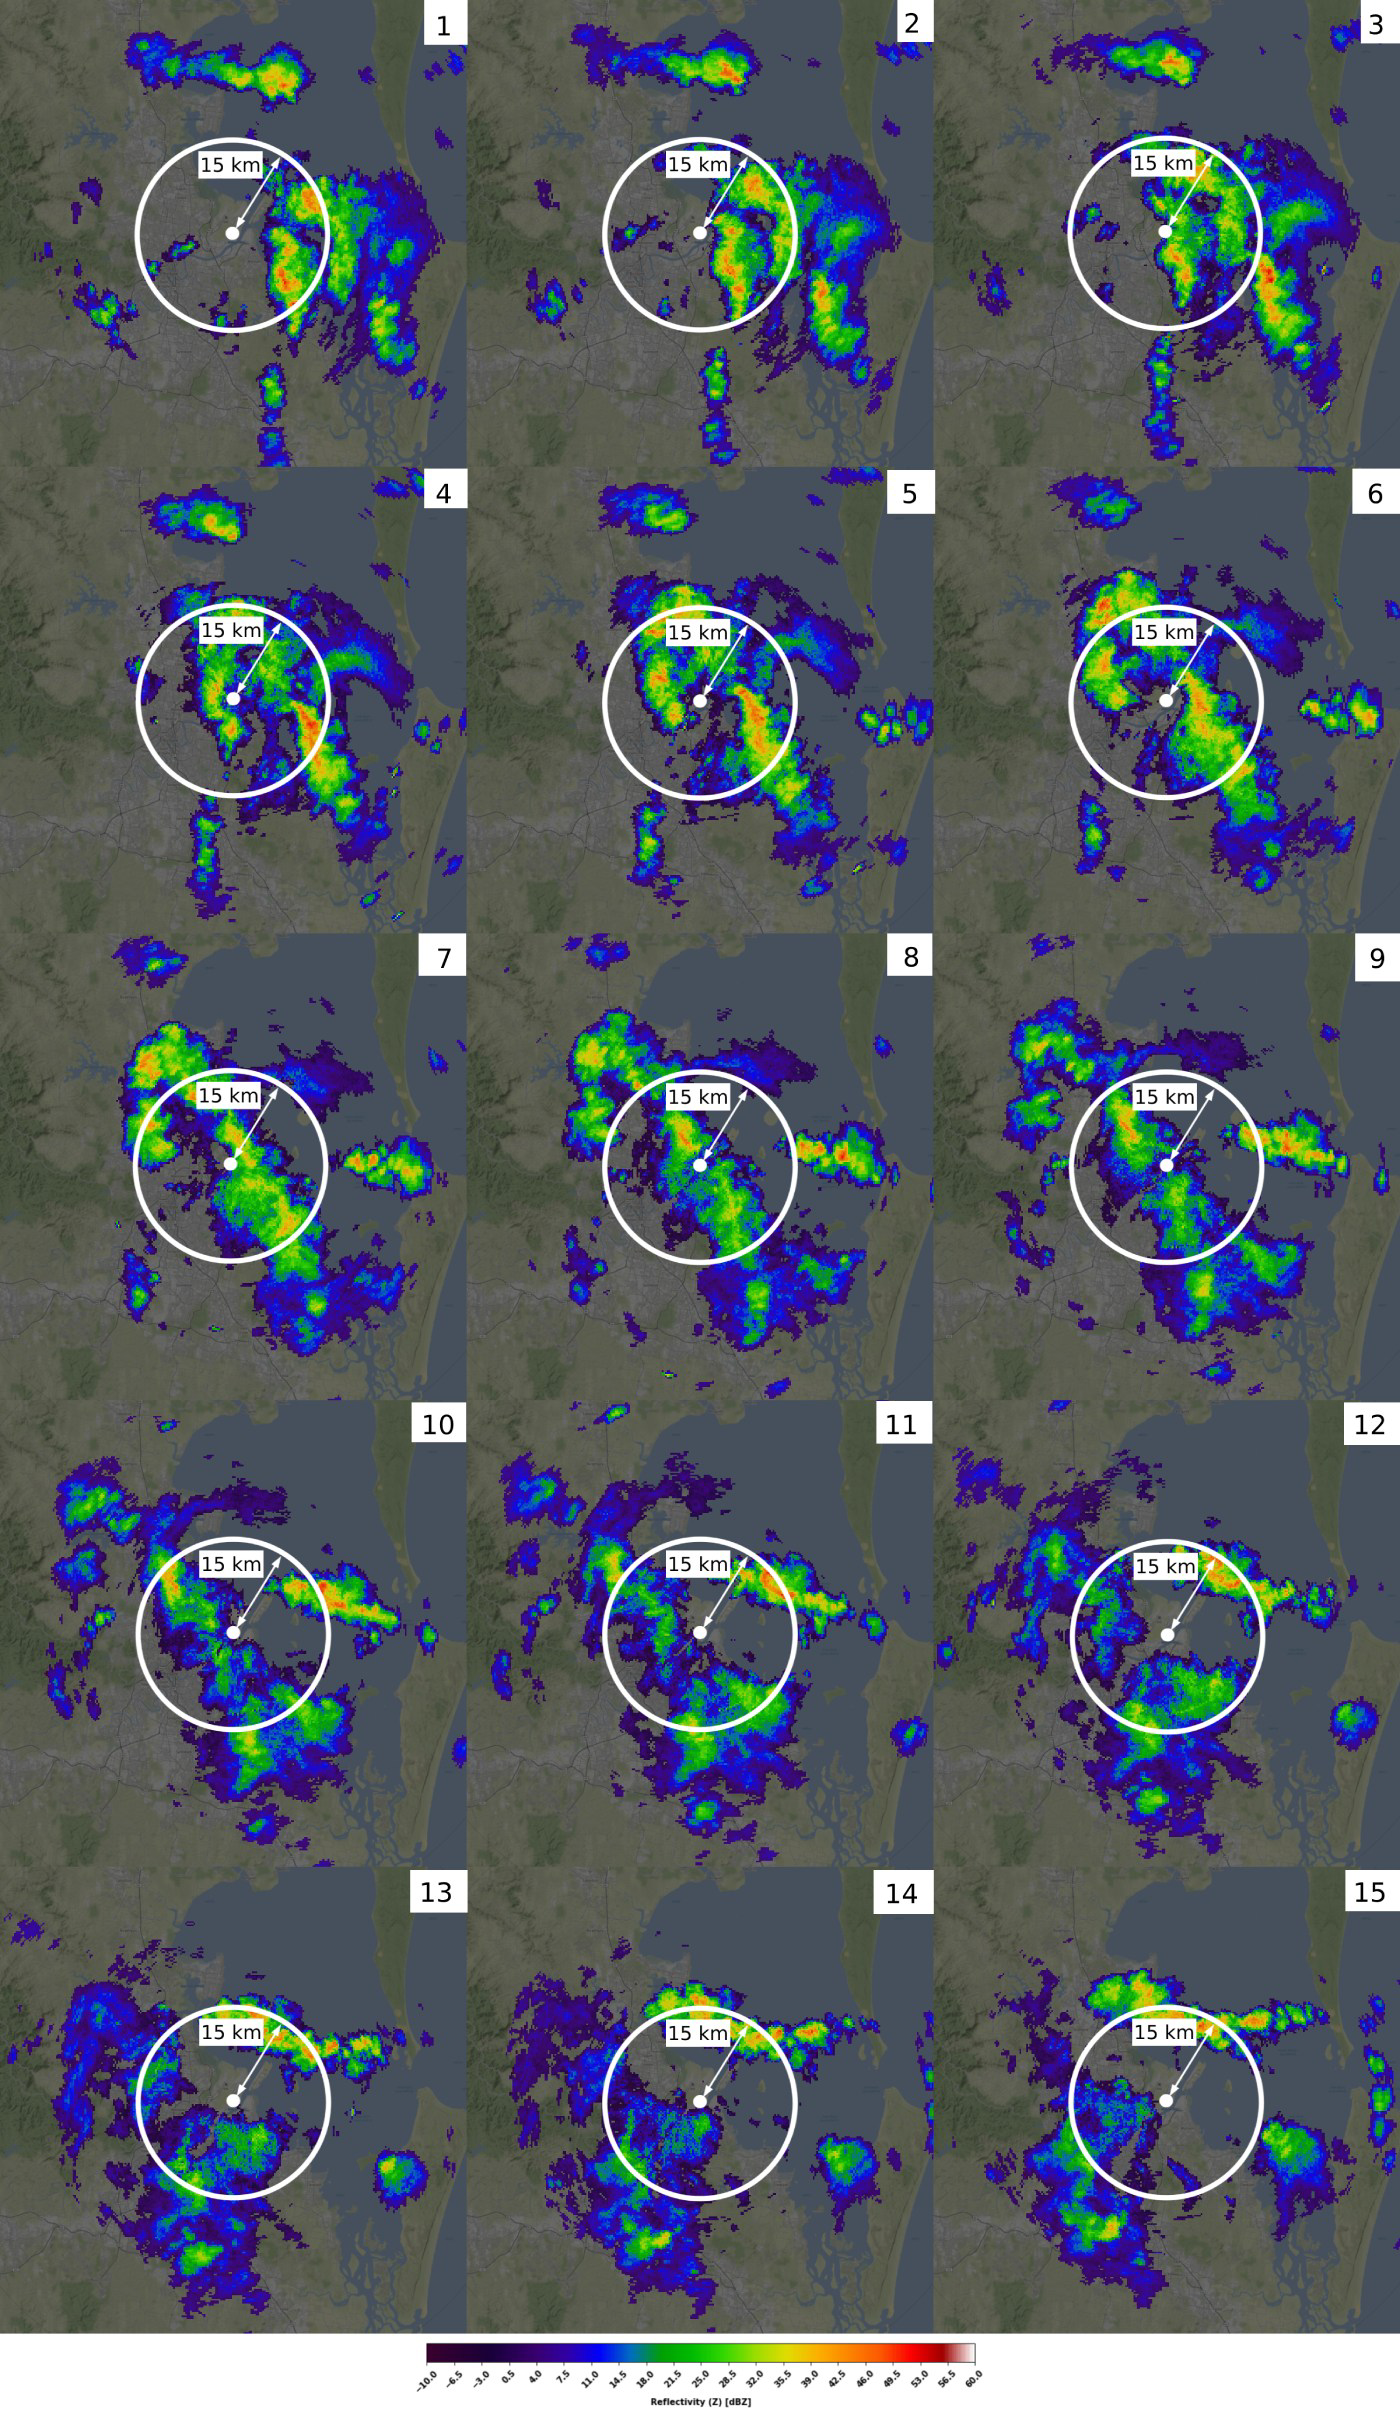
Solid-state Radar “Blind Range”
The Meteopress radar offers a solution that effectively addresses the concern of a 15 km blind range, commonly associated with solid-state radars when using a ~100us pulse. As a result, data are available in the vicinity of the radar and there is no blind area within the first 15 km of the radar’s range.
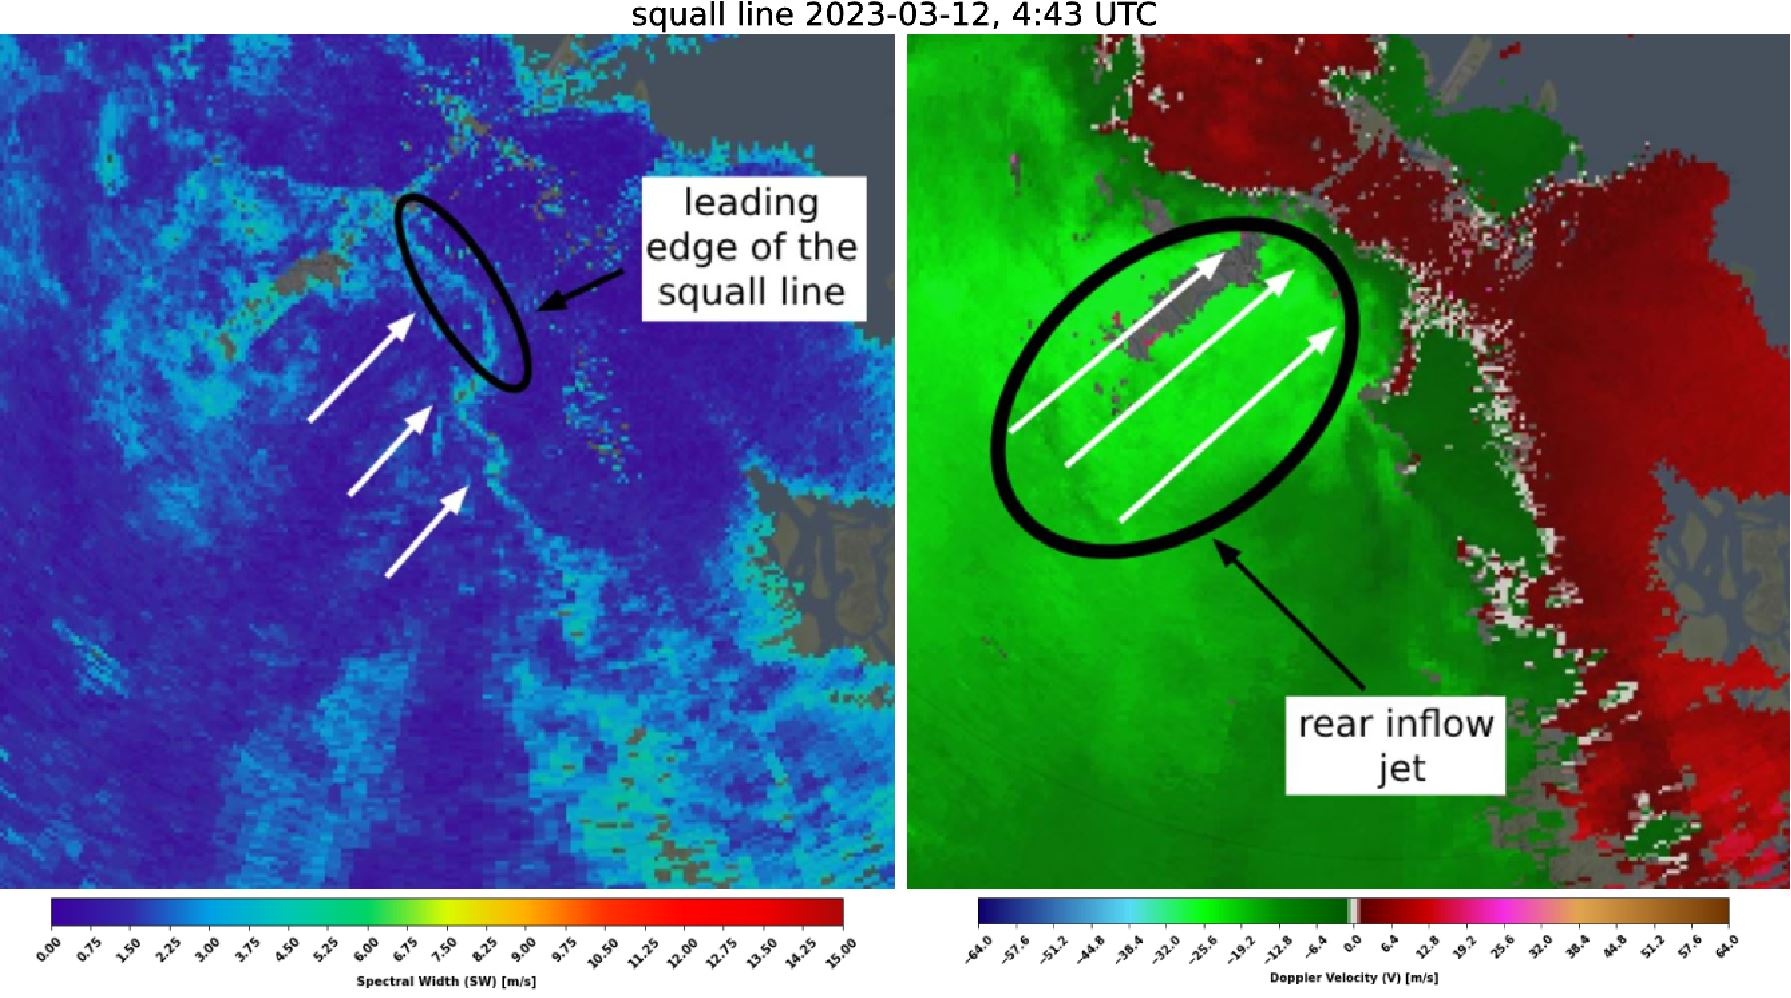
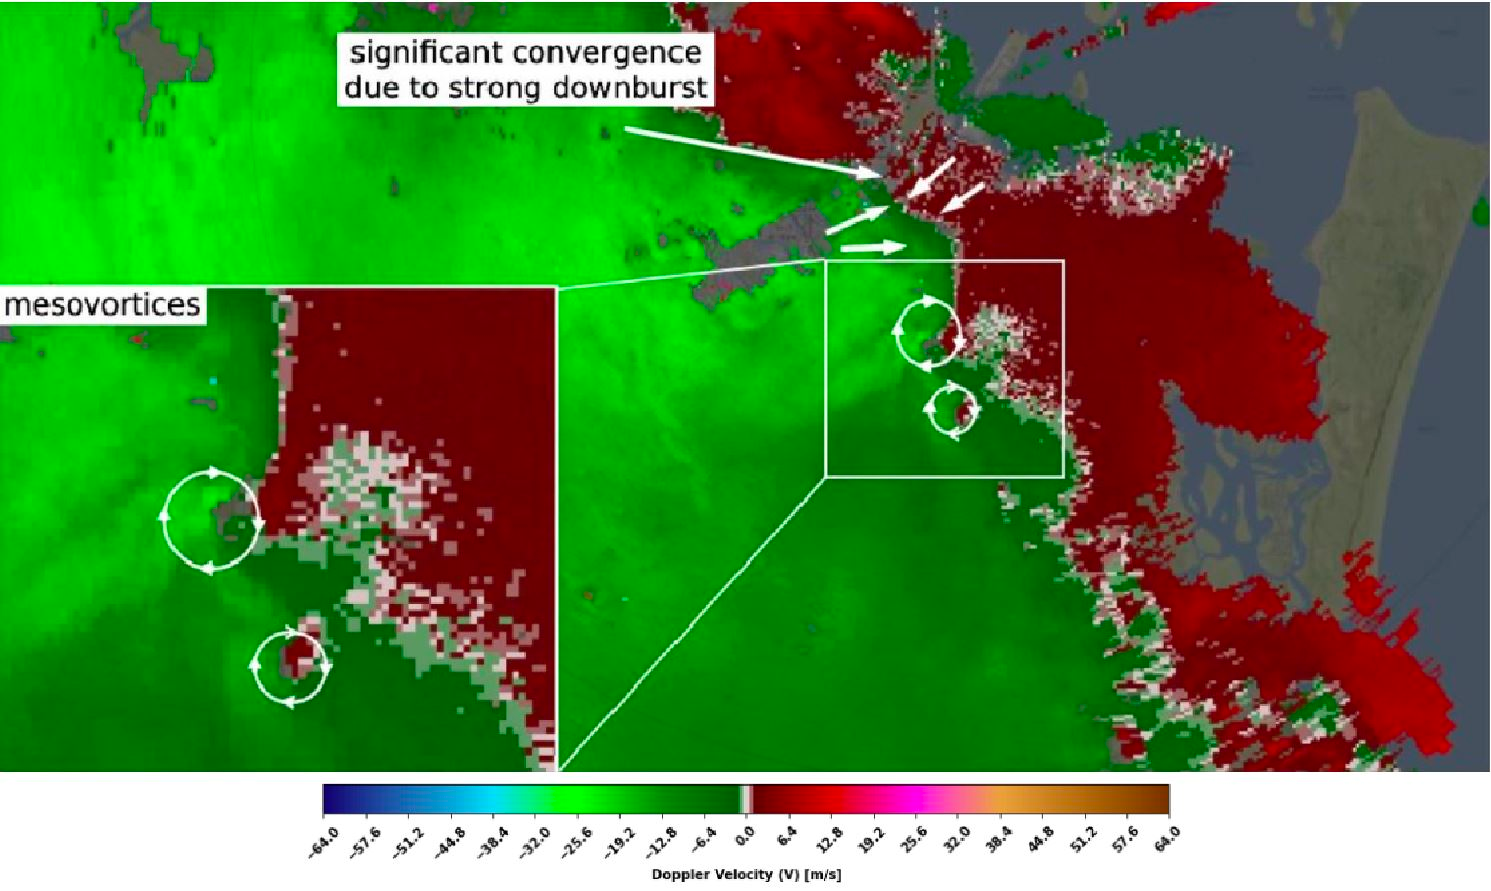
Severe situation: Squall line with mesovortices and downbursts
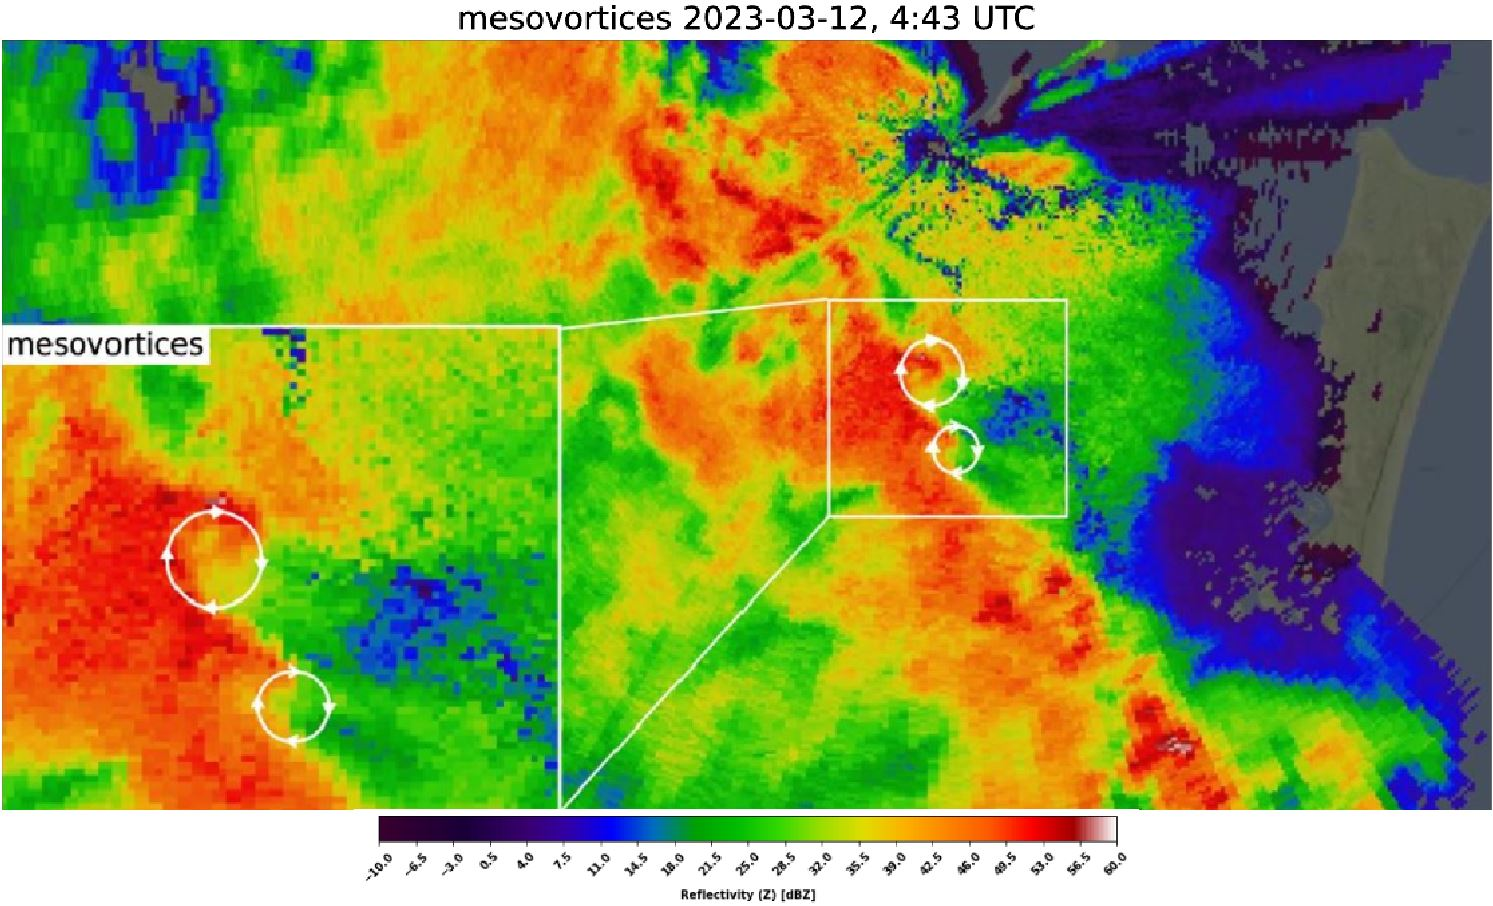
On March 12, 2023 the storms near Brisbane were organized into a squall line that was accompanied by heavy rain and downbursts. During the squall line development, radar detected a lot of regions with potential downbursts. Along the squall line, there was strong convergence; therefore, some low-level mesovortices started to develop, mainly near the downbursts because downbursts can accelerate the line of storms near the regions where they occurred. Low-level mesovortices were mostly weak, but one of them was stronger with a significant region of weak radar reflectivity in the inflow region. The region with significant convergence was visible in spectrum width as a narrow line of high values. Narrow line is waved, which indicates the development of mesovortices.
Severe situation: April 7, 2023
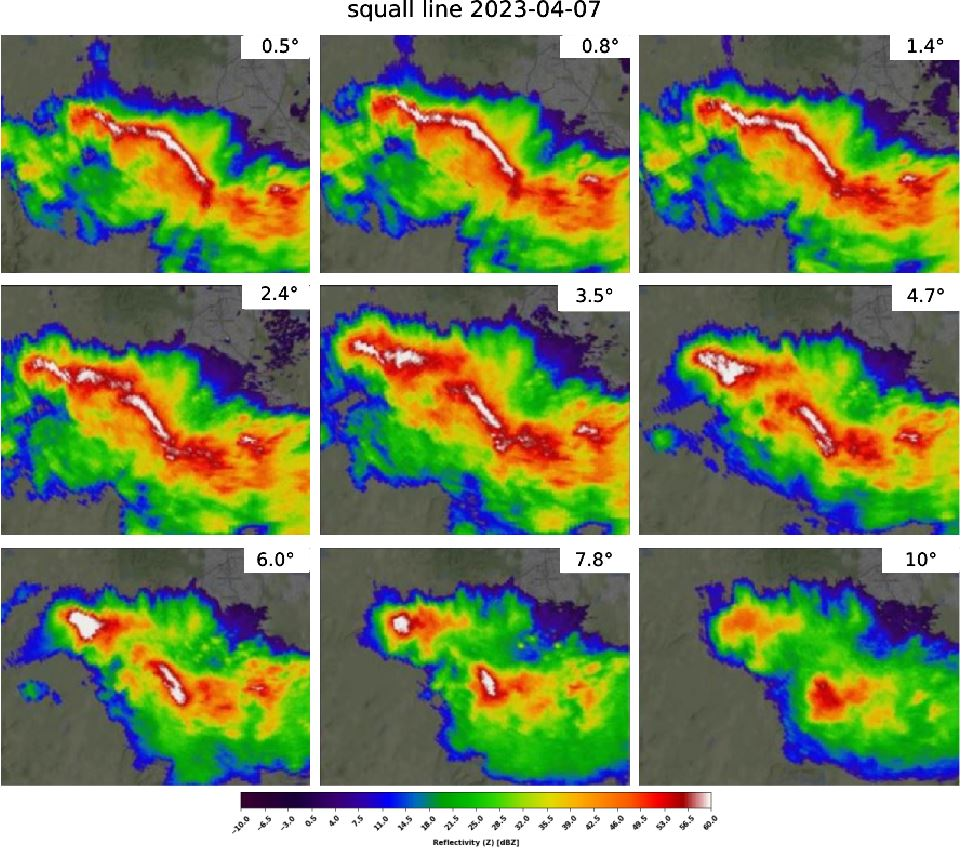
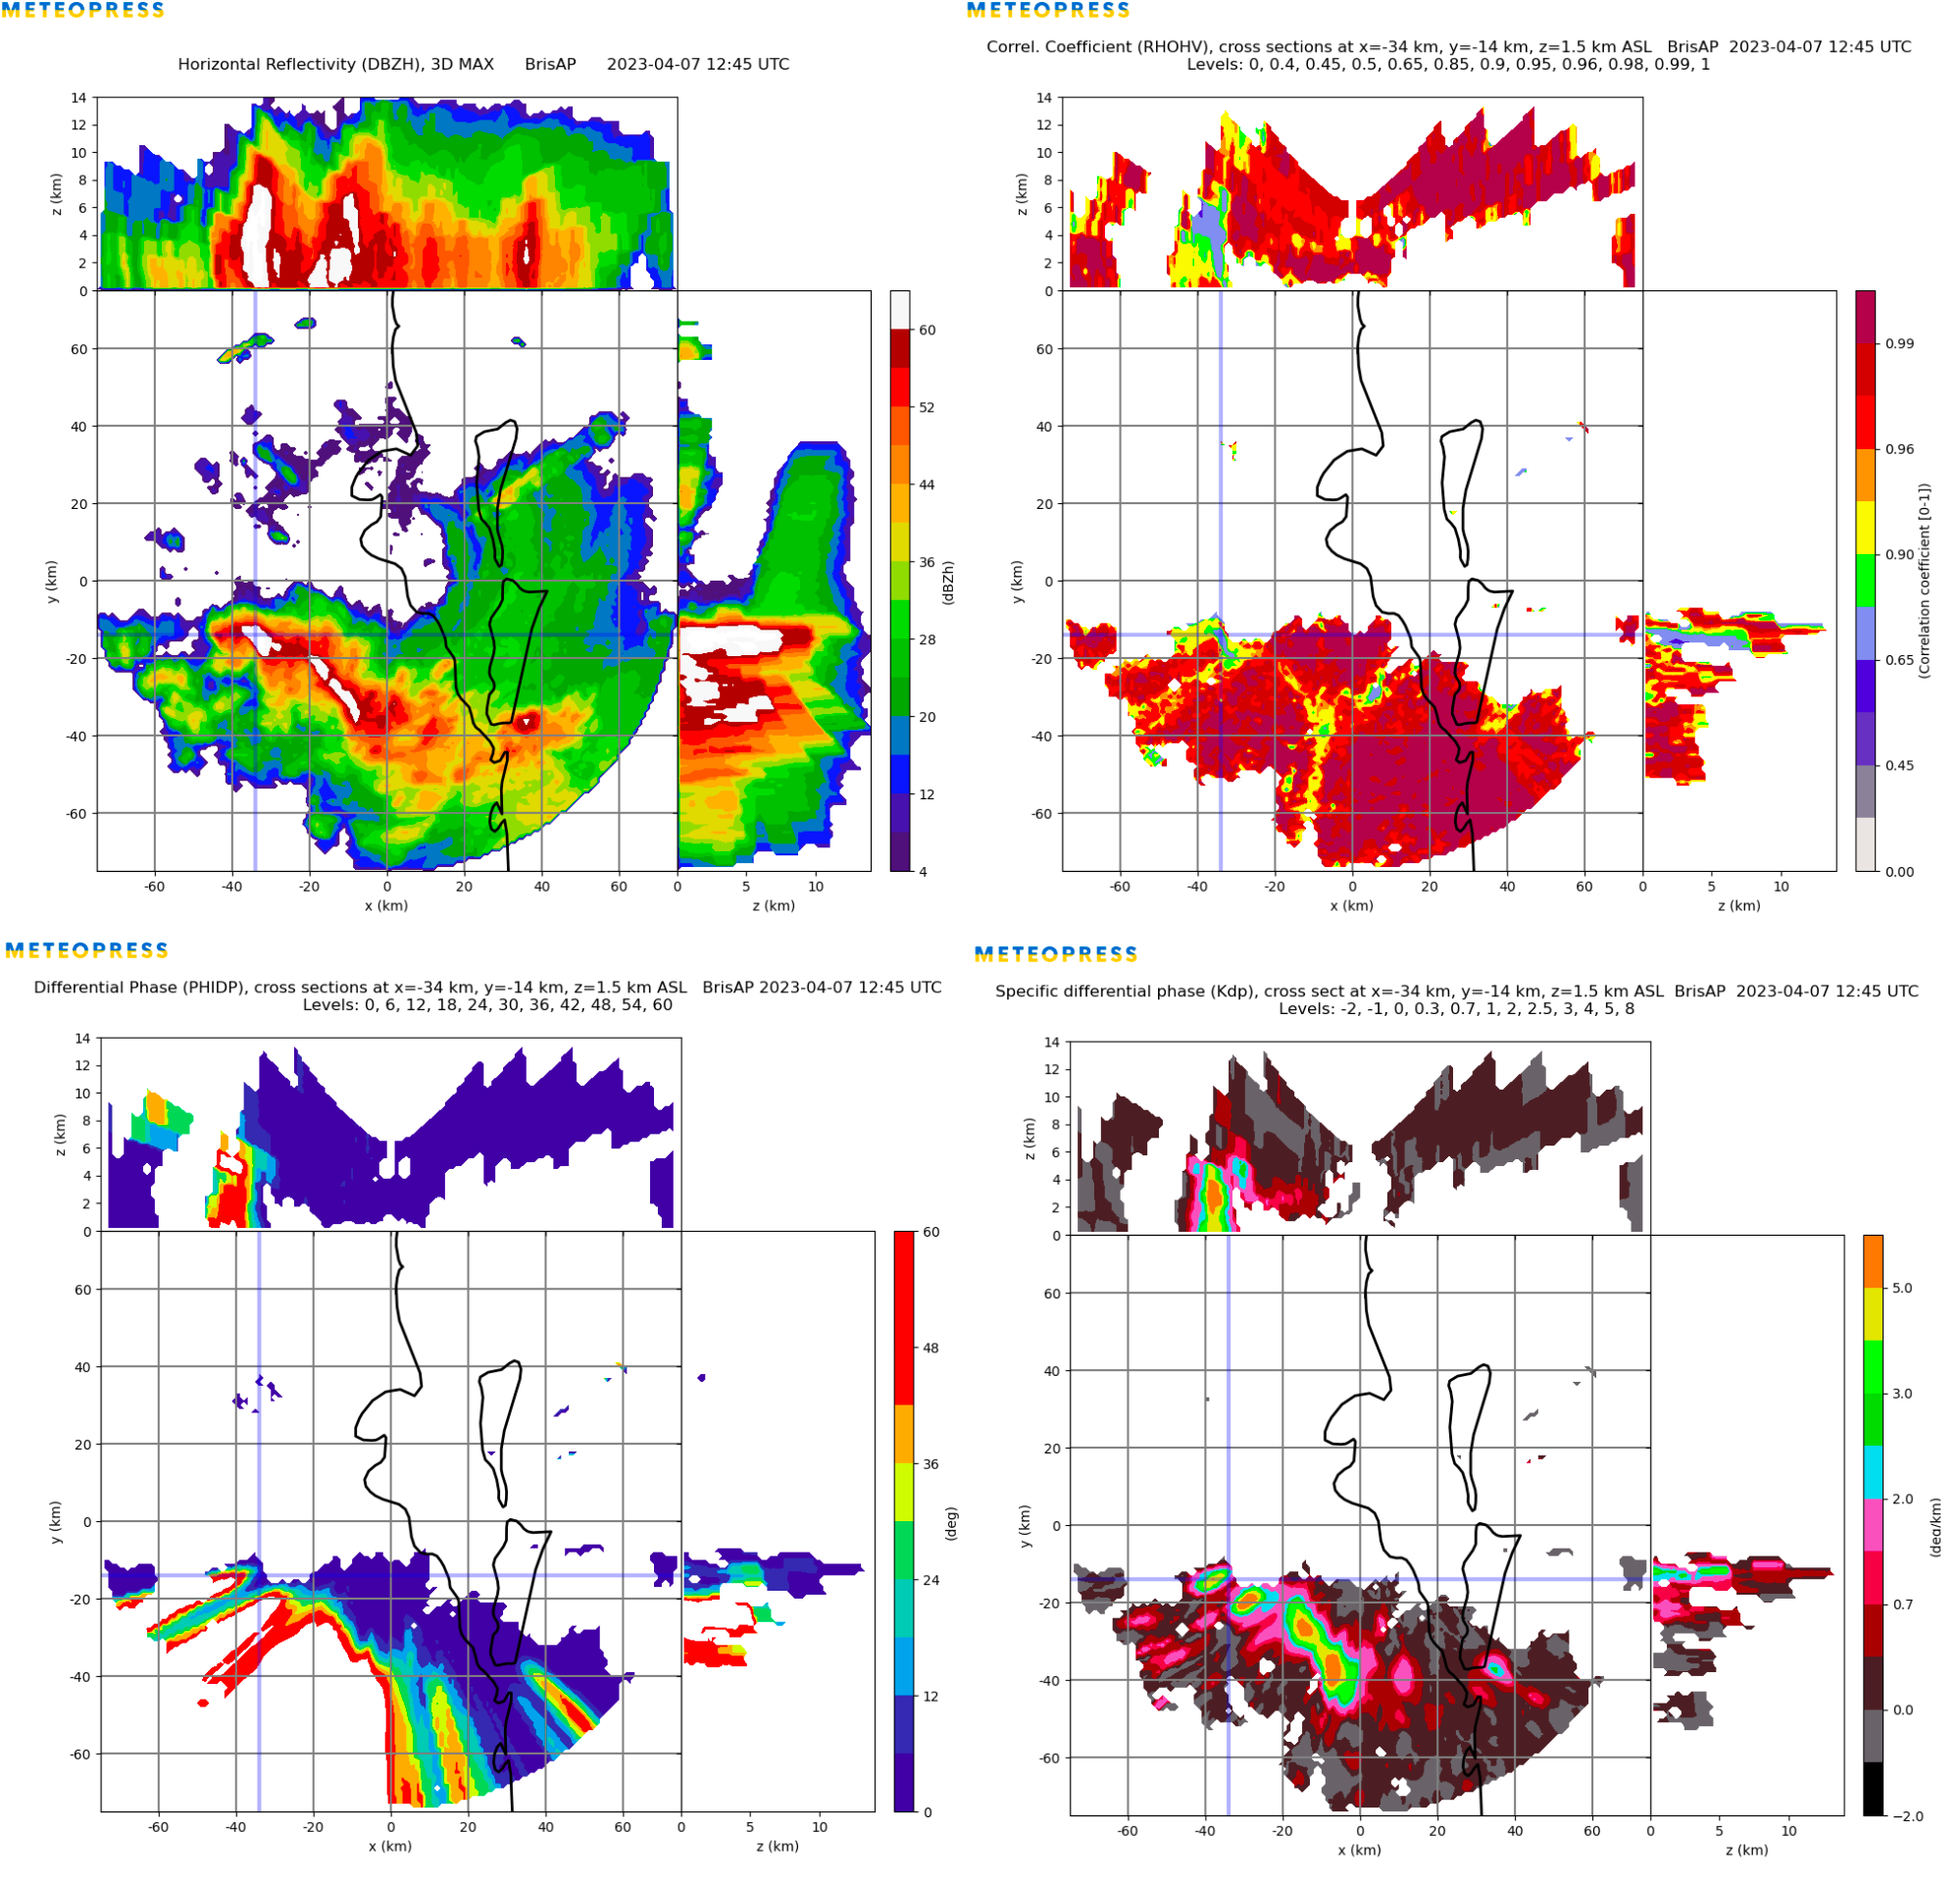
On April 7, 2023, one of the most severe situations occurred with intense thunderstorms. After numerous supercells that occurred near Brisbane, Meteopress weather radar caught the squall line that was accompanied by downbursts and hail. High values of KDP (specific differential phase) suggest the presence of downbursts in regions with heavy torrential rain. Large values of differential phase suggest the attenuation of radar signal in heavy precipitation. In the northern part of the squall line, the supercell formed with hail, and the column of radar reflectivity above 60 dBZ reached 8 kilometers in height. Then the squall line with the supercell continued over the sea.
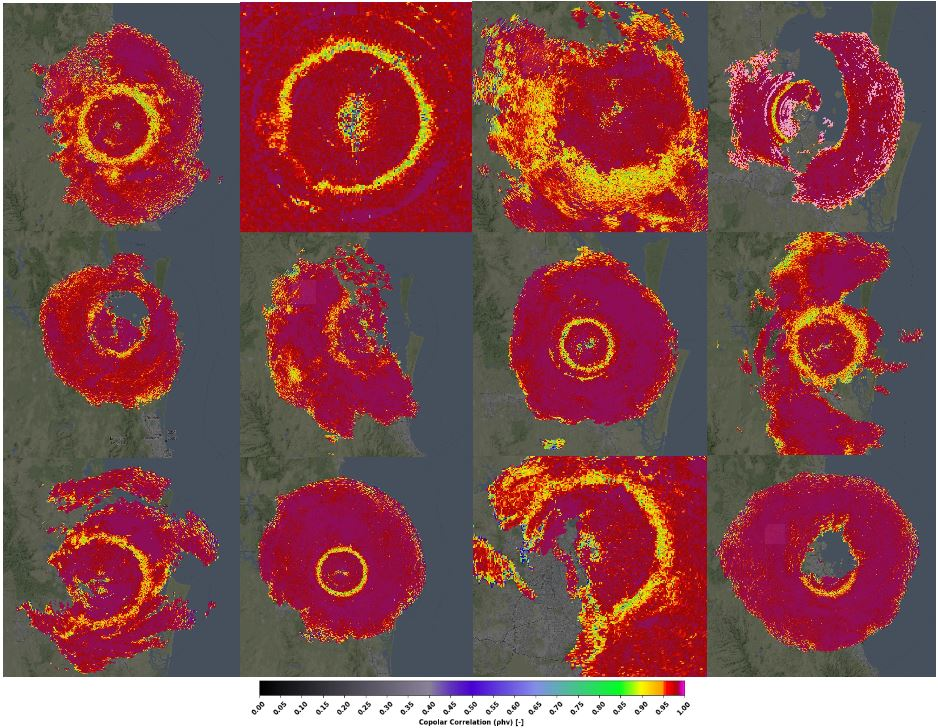
Hailspikes, 10 cm hail, possible tornado
On April 7th, 2023, Supercells were accompanied by giant hail measuring up to 10 cm in diameter. The presence of a tornado within one of the supercells was reported by stormchaser “Funnel cloud, which briefly touched the ground”.
At first, two supercells developed around 200 kilometers from the weather radar. Gradually the supercells were getting closer to the radar. The closest supercell was around 100 kilometers from the radar. These supercells had typical signs for very severe supercells. On ZDR was a very well developed ZDR arc (part of a supercell with large values of ZDR closer to the inflow area in the lowest elevations). Inflow was very strong because the weak radar echo region is visible on all elevations. Regions with low correlation coefficient (RhoHV) are typical for strong inflow, lower values around 0.8 for hail. KDP values around 0°/km suggest the presence of large hail too.
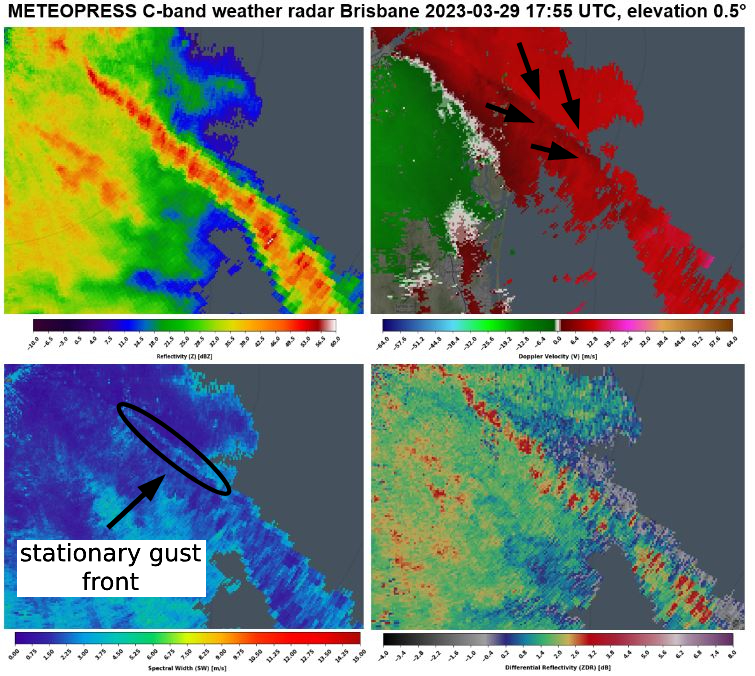
Stationary gust front and train effect: August 15, 2023
Training effect is dangerous due to storms moving in a single path and therefore producing longer lasting, heavy precipitation. Training occurs along stationary fronts or as in this instance, along a gust front. This gust front is visible on weather radar as a narrow line with higher spectral width values.
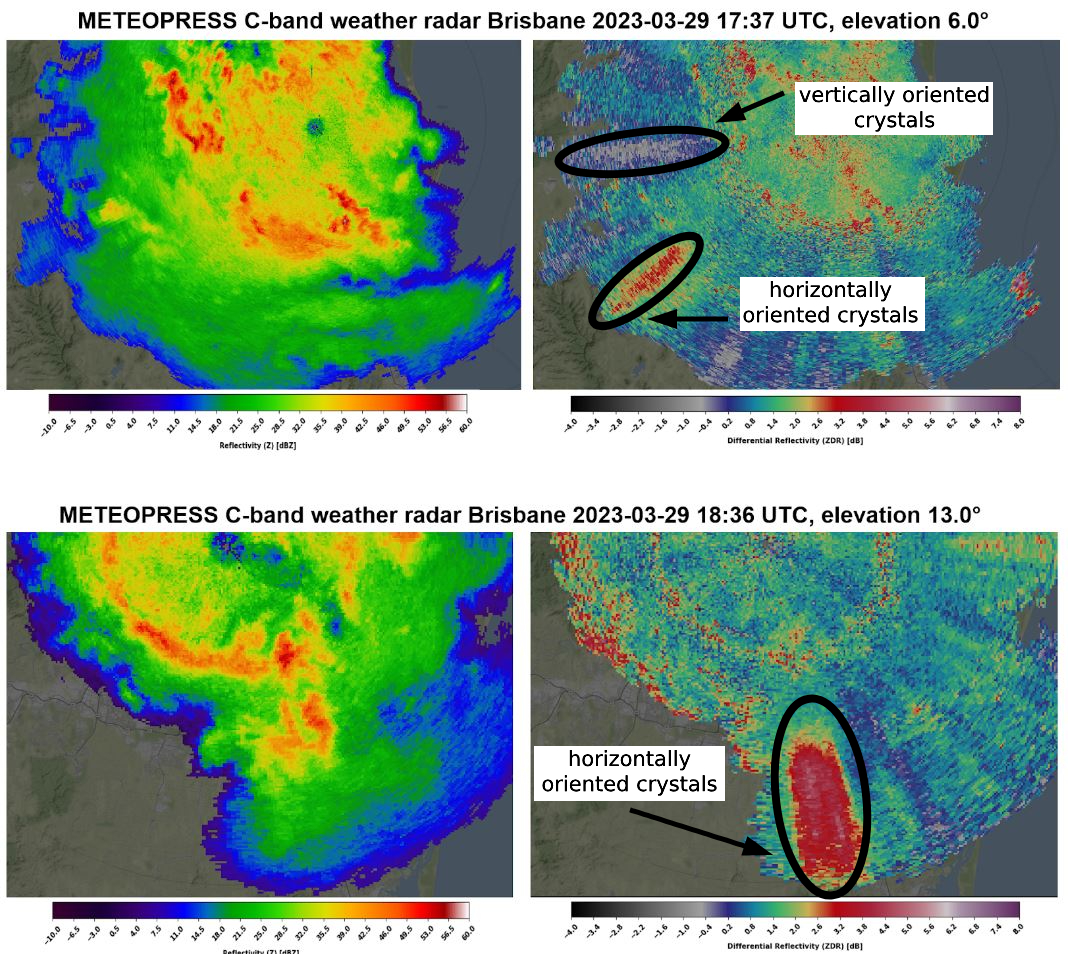
Ice depolarisation
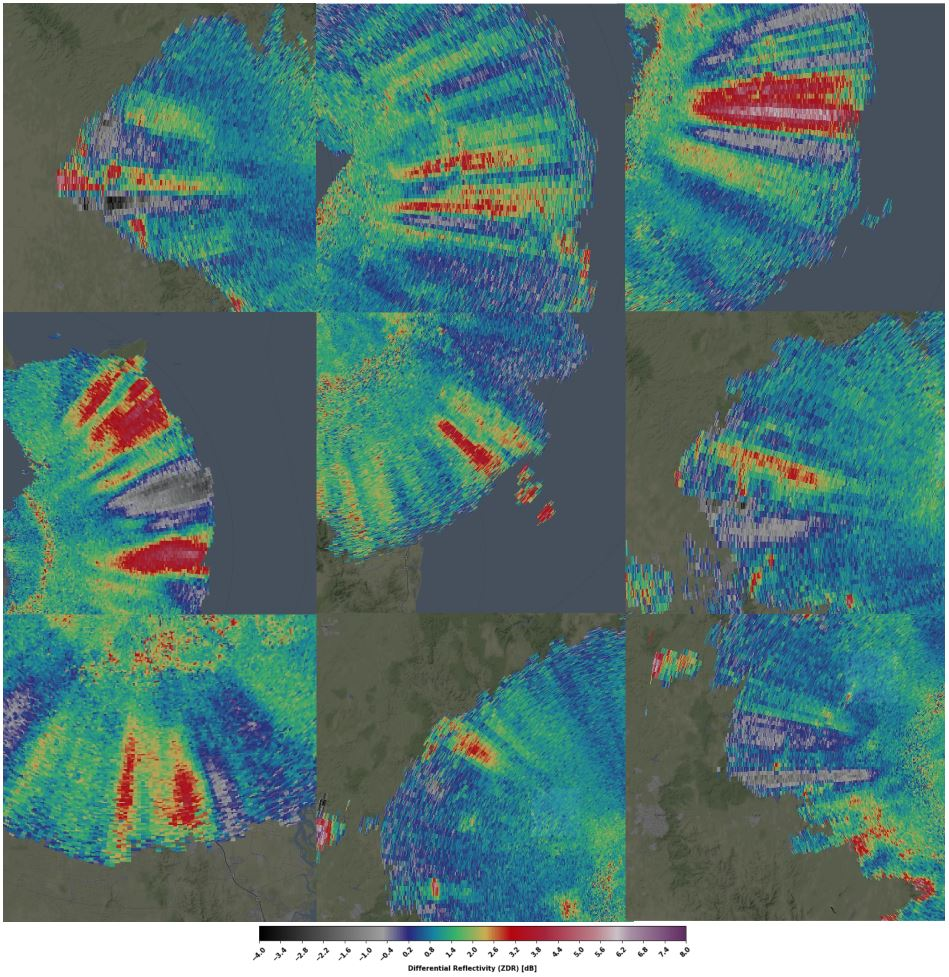
Ice depolarization can occur at high altitudes when an electric field is present in the clouds. This electric field then orientates ice crystals vertically or horizontally. This is then visible in ZDR data as an area with low or high values (depending on the orientation of the crystals) in the form of an ray pointing towards the radar. Presence of this signature can occur even before first lightning occurs and can serve as an preindicator of a thunderstorm.
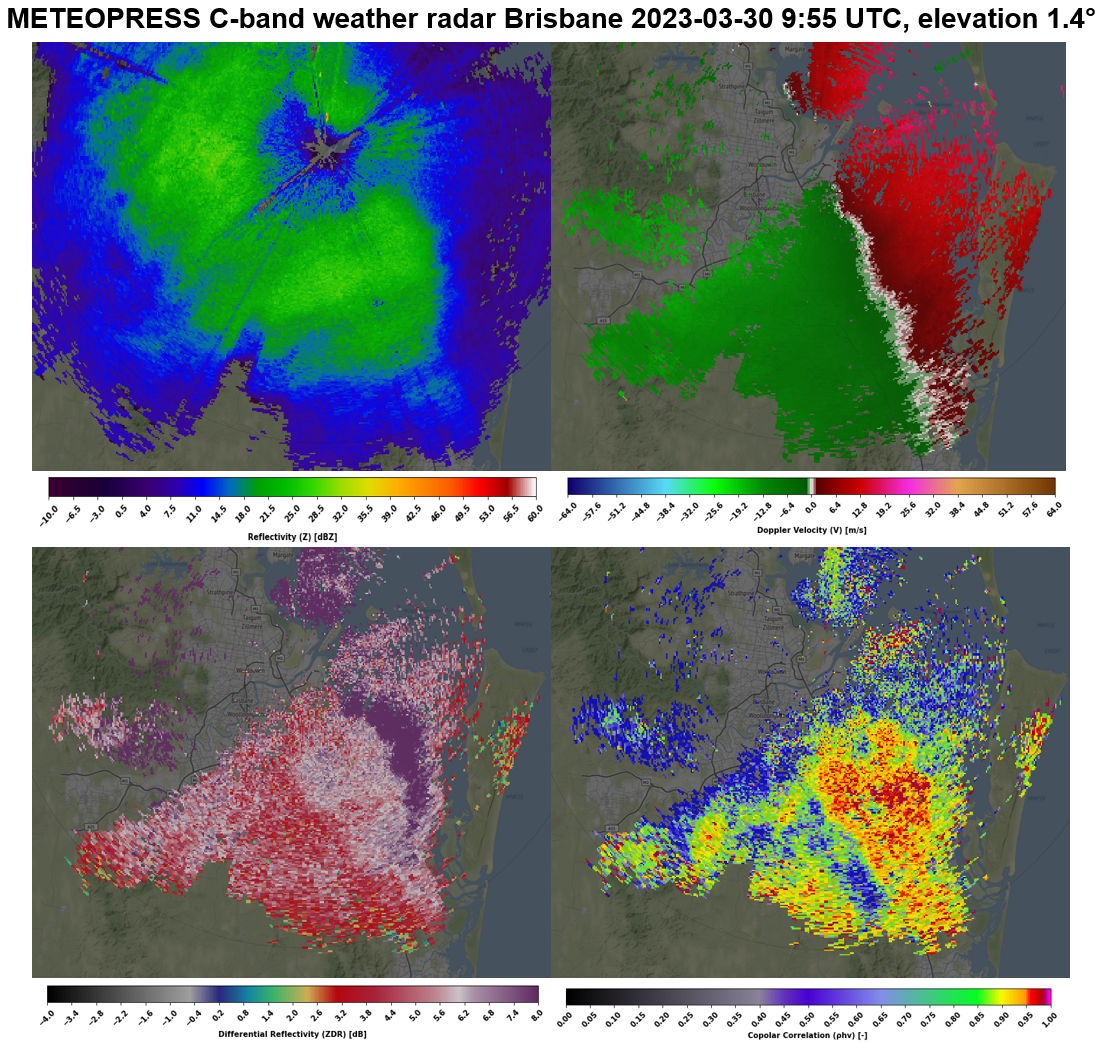
Non-meteorological targets: Birds and Insects
Other forms of clutter include biological targets - birds and insects - are visible in Brisbane almost every day, mostly between sunset and sunrise. They have low to medium values of reflectivity, very high ZDR and low RHOHV due to their shape. Doppler velocity tends to correspond with wind direction.
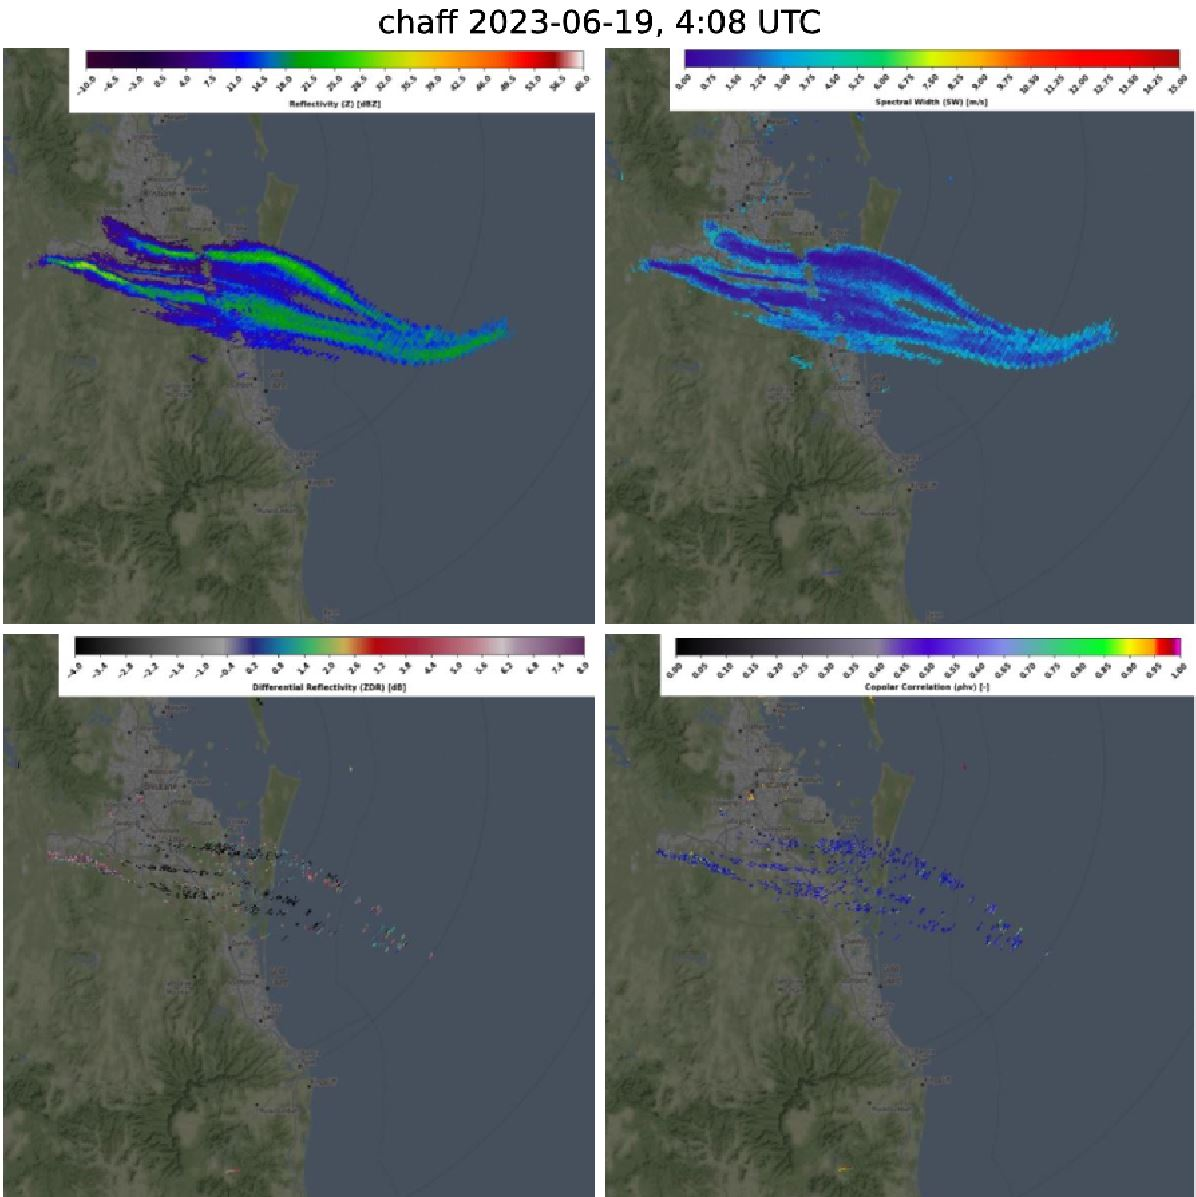
Chaff
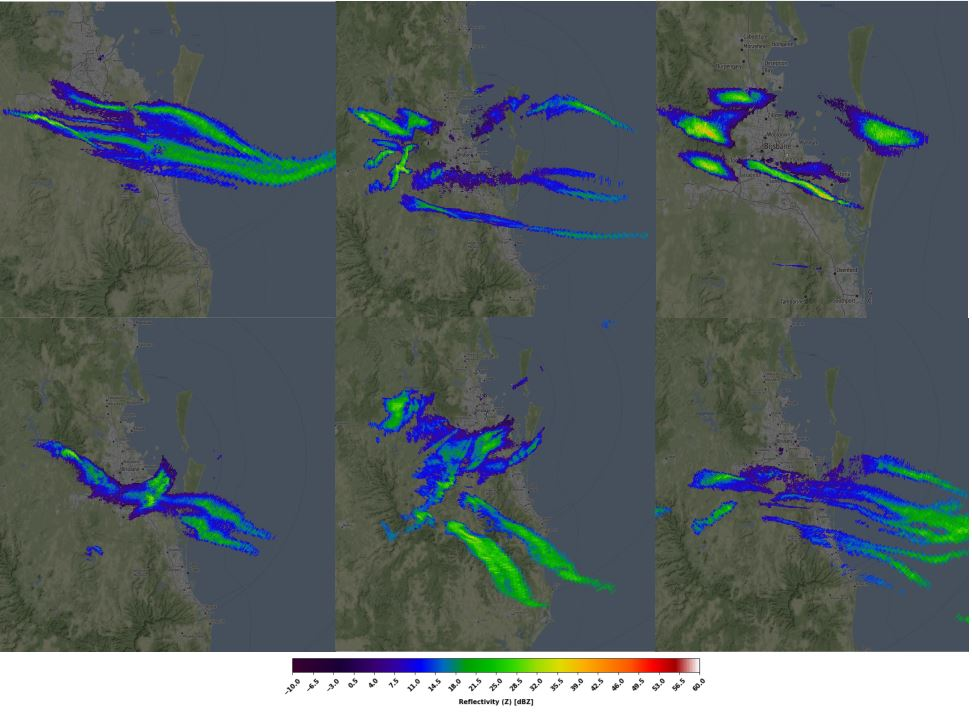
Chaff is used by the military to blind the radar by dispersing highly reflective particles (usually aluminum foil fragments) in the air. And by looking at the pictures below, it works! Reflectivity is low to medium, ZDR is very noisy and RhoHV very low. Doppler velocity corresponds to the wind direction. In Brisbane Airport radar area, the chaff can be seen pretty often.
Chaff on June 19, 2023
Summary
The Meteopress solid-state radar installed at Brisbane Airport has provided a one year service for the Brisbane city and surrounding area. Serving as a reliable backup data source it was often a single primary source of weather radar data over the Brisbane city. Its high operational reliability has been well-demonstrated over the past year, ensuring consistent and uninterrupted weather monitoring. As showcased in this article, the radar has captured a range of interesting meteorological situations, contributing to continuous monitoring of local weather phenomena.
Meteorological oversight by: Filip Najman, Miloslav Staněk