Czech Republic Sees First Tornado of 2025
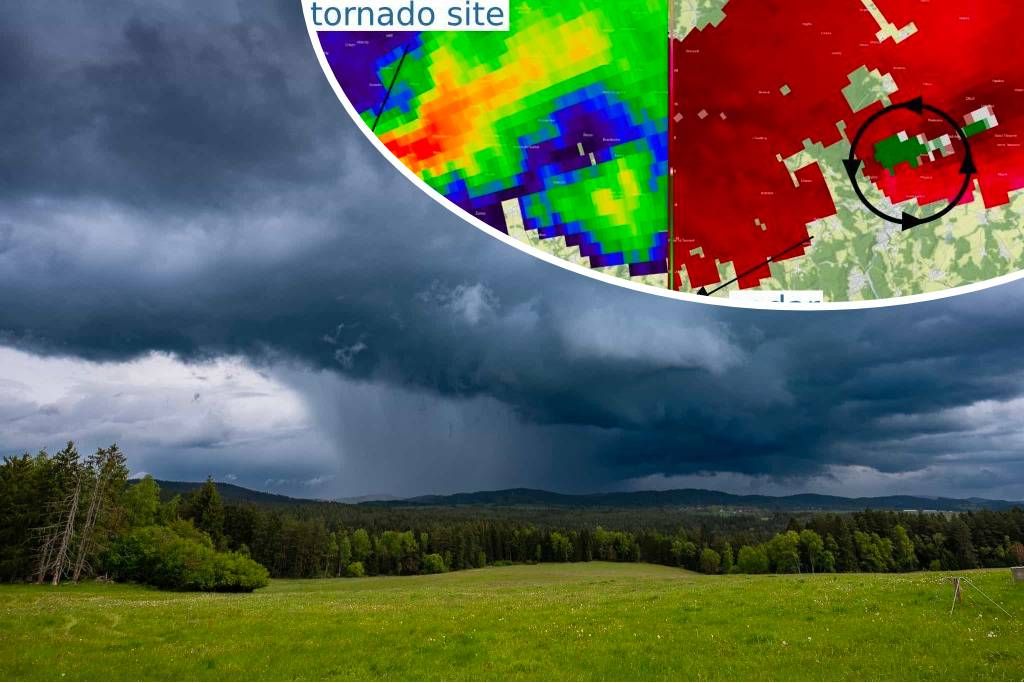
On Sunday, May 18th, around 10:45 AM UTC, the first tornado of 2025 in the Czech Republic occurred in the village of Vyšný, near Český Krumlov. The tornado developed from a shower moving in from the northwest.
Although the tornado was not directly documented in photos or videos, eyewitness reports of a rotating vortex and loud noise, along with a characteristic type of damage, make its occurrence almost certain. The damage was concentrated primarily in vegetation—several trees were uprooted or broken. Preliminary estimates indicate the damage swath was approximately 100 meters wide and the tornado’s path about 1 kilometer long.
This was a weaker tornado, the kind that appears several times a year in our region. That afternoon, increased low-level wind shear was present in the area, and the bases of convective cells were low—conditions that are favorable for tornado formation.
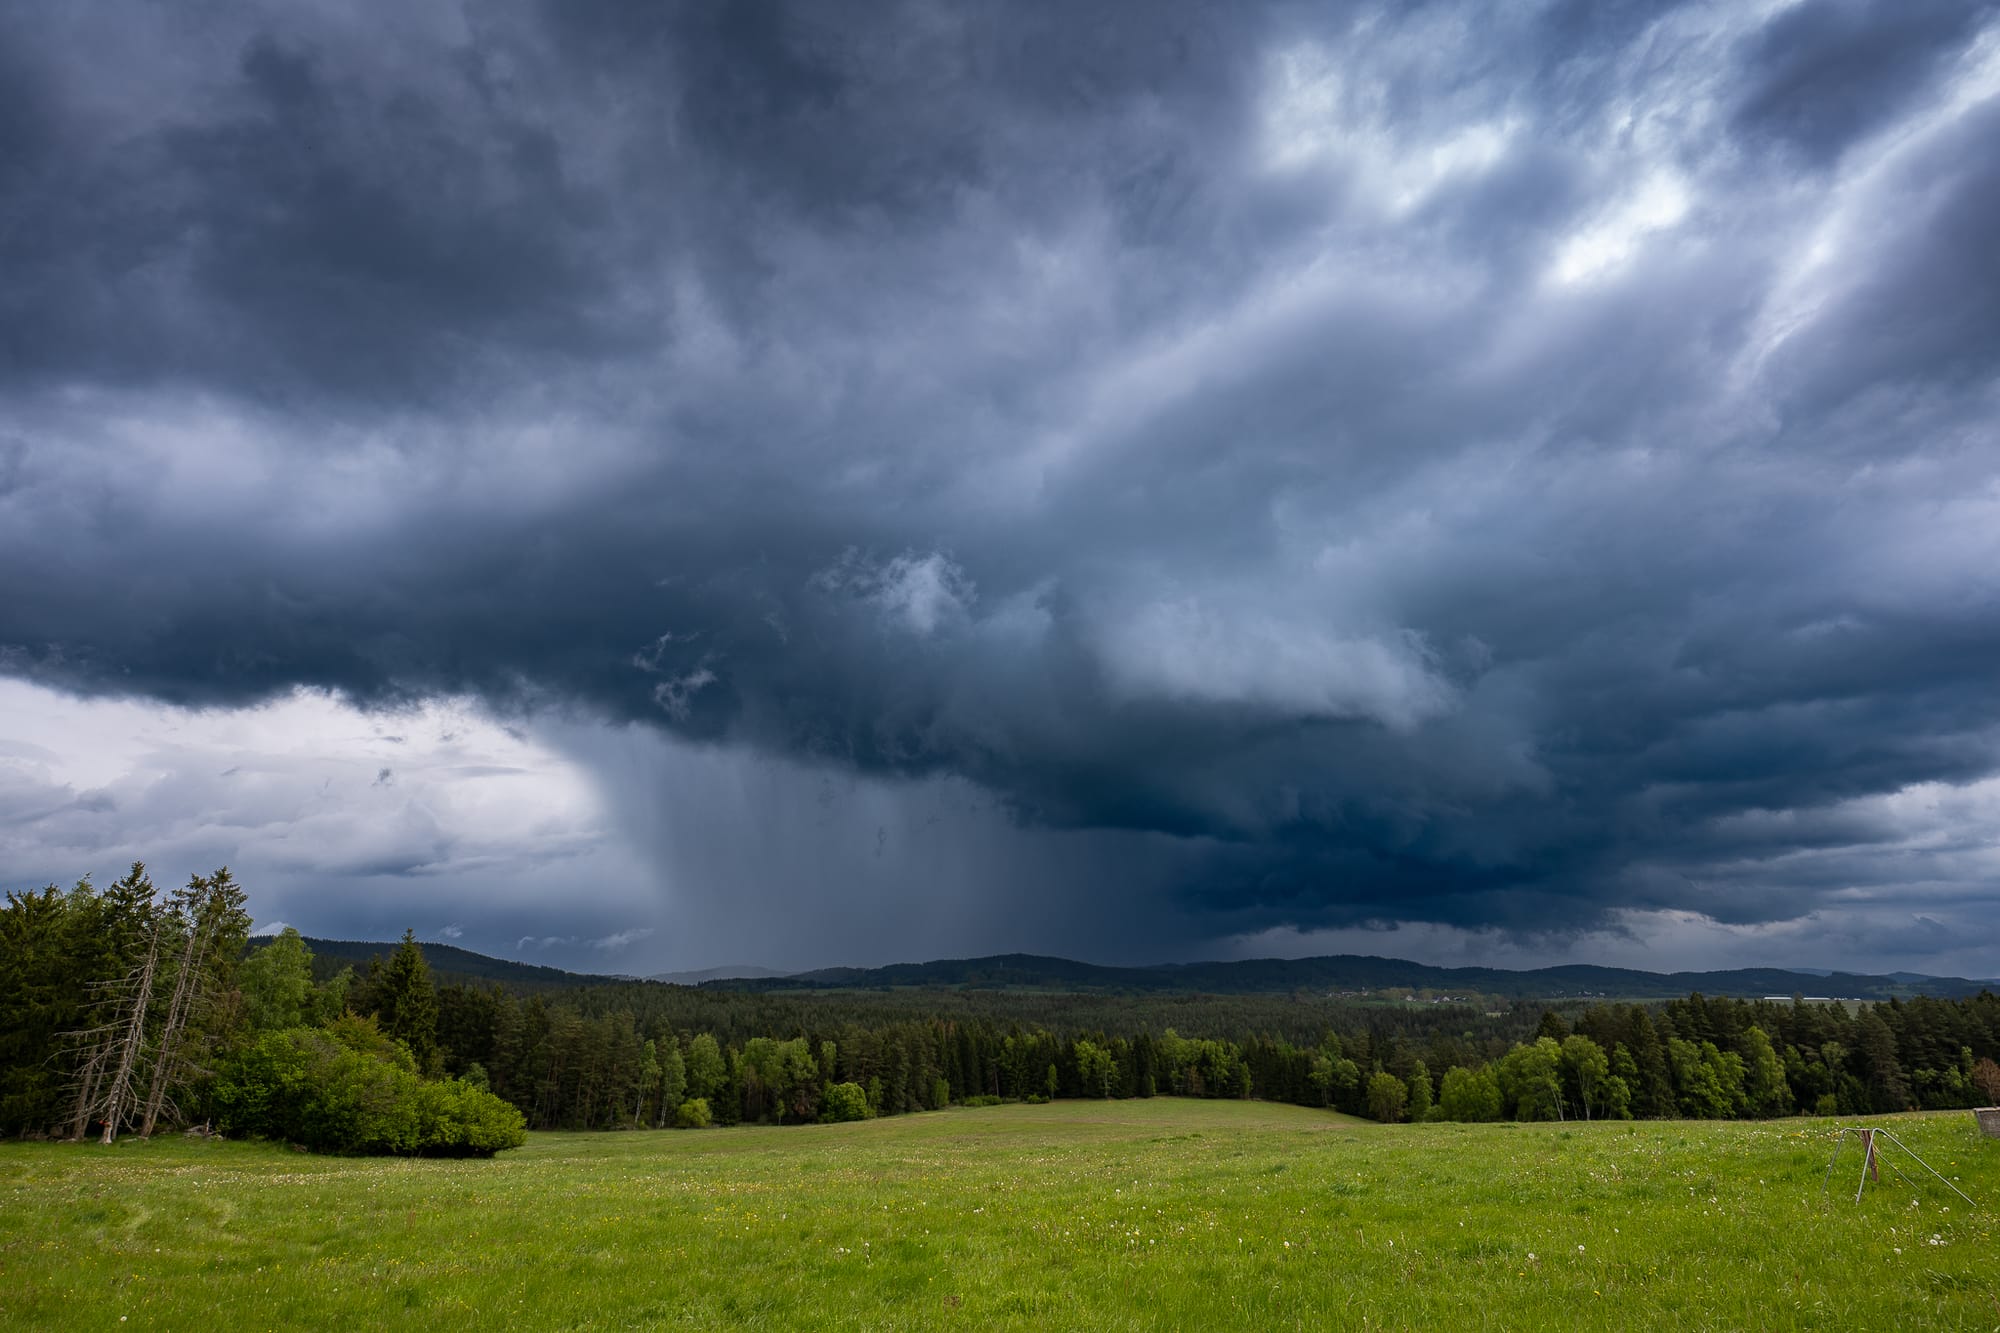
Shower which produced the tornado. Photo by Budweiser Storm Chasers.
Hochficht radar
Detailed insight into the shower is provided by data from the Hochficht weather radar (1350 m ASL, Meteopress C-band radar operated by GeoSphere), which in reflectivity product shows a typical “hook echo”—a curved reflectivity pattern associated with a supercell structure. Doppler velocity data also reveals rotation indicative of a mesocyclone, a rotating part of the storm. These signs of rotation appeared about 30 minutes (Picture 1) before the tornado event and were still visible during its occurrence (Picture 3). It is important to note, however, that rotation detected by weather radar does not directly indicate a tornado, but rather a mesocyclone within a convective cell.
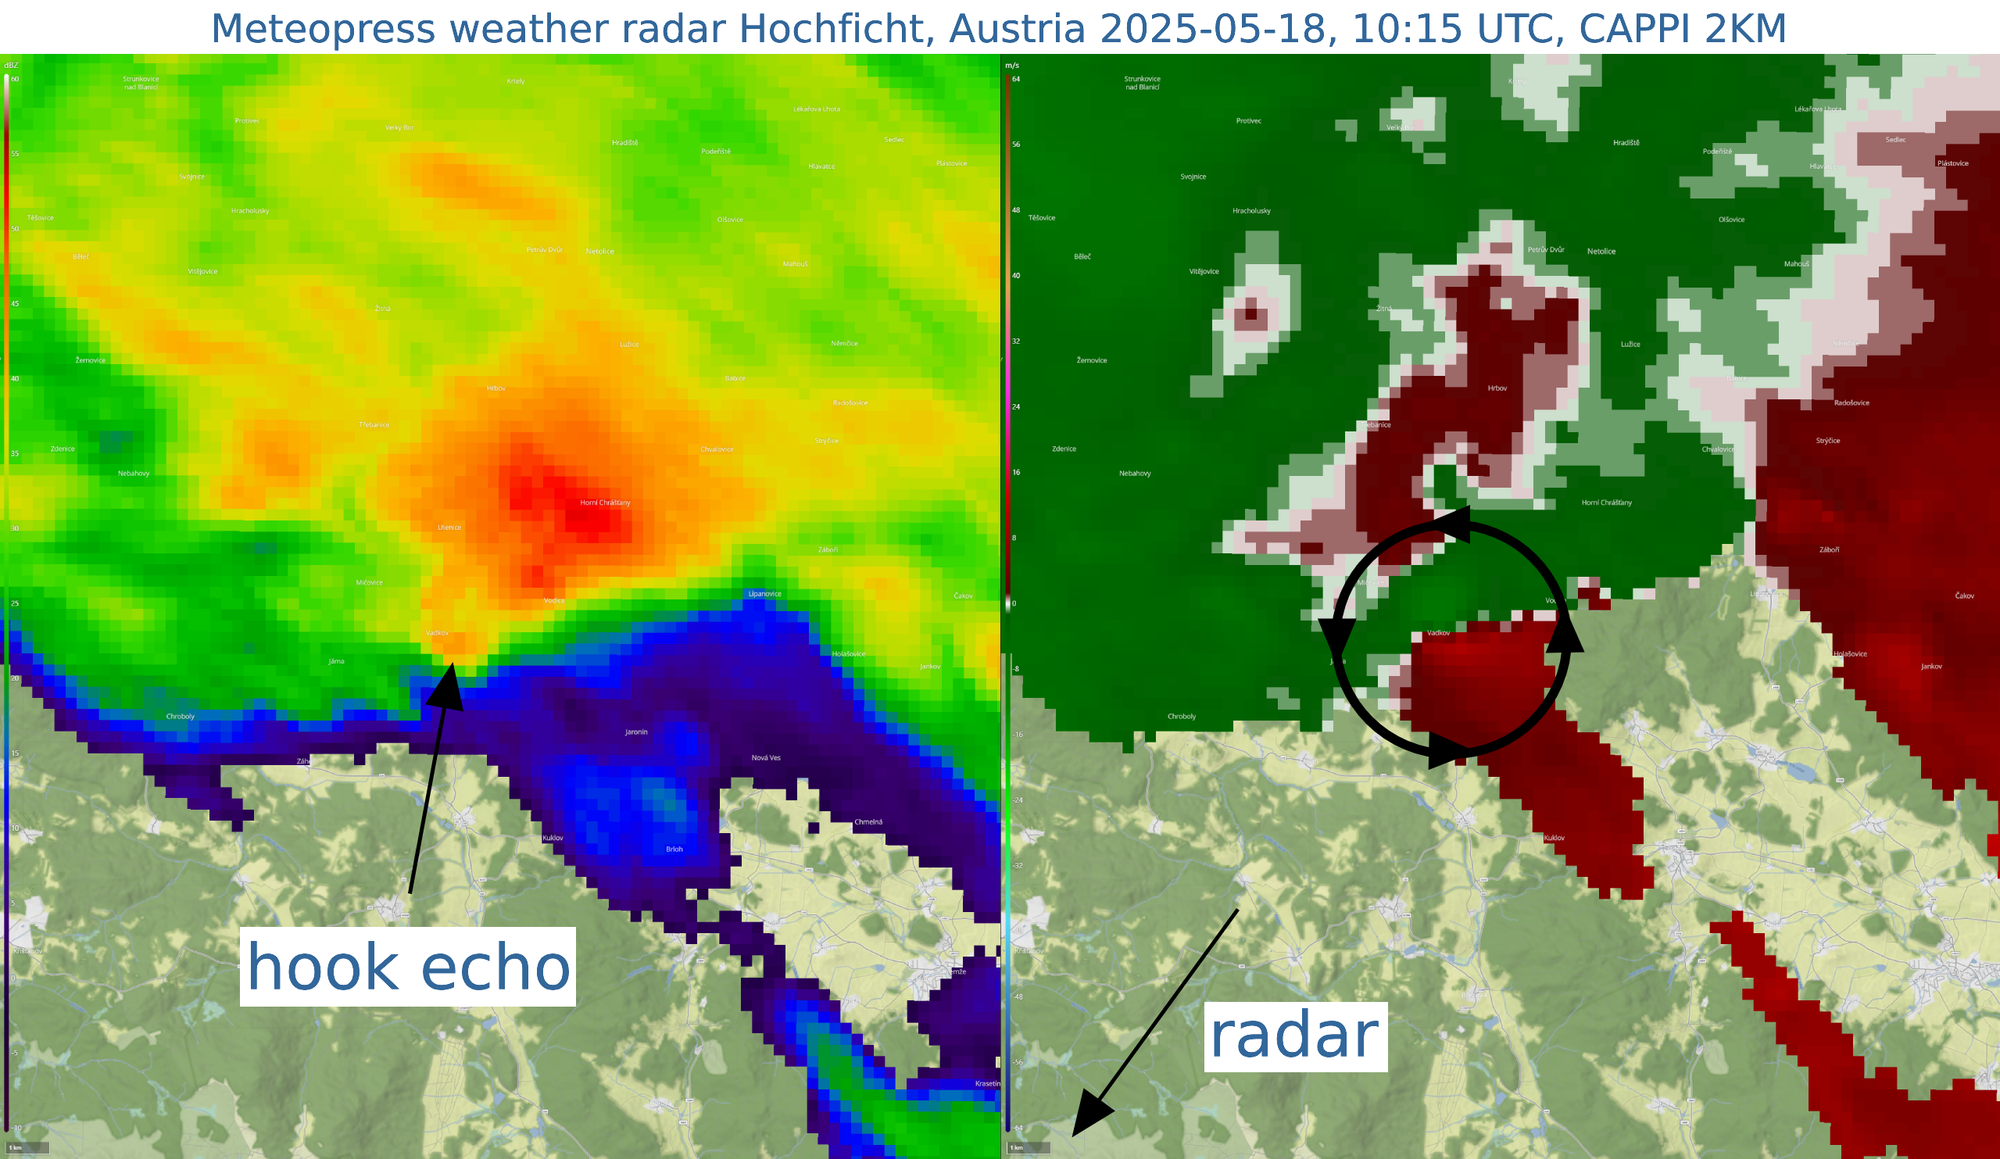
Picture 1: Shower with a mesocyclone and a faint hook echo 30 minutes before the tornado. May 18, 2025, 10:15 AM UTC, 2 km CAPPI, Hochficht radar. Radar reflectivity (left), radial velocity (right).
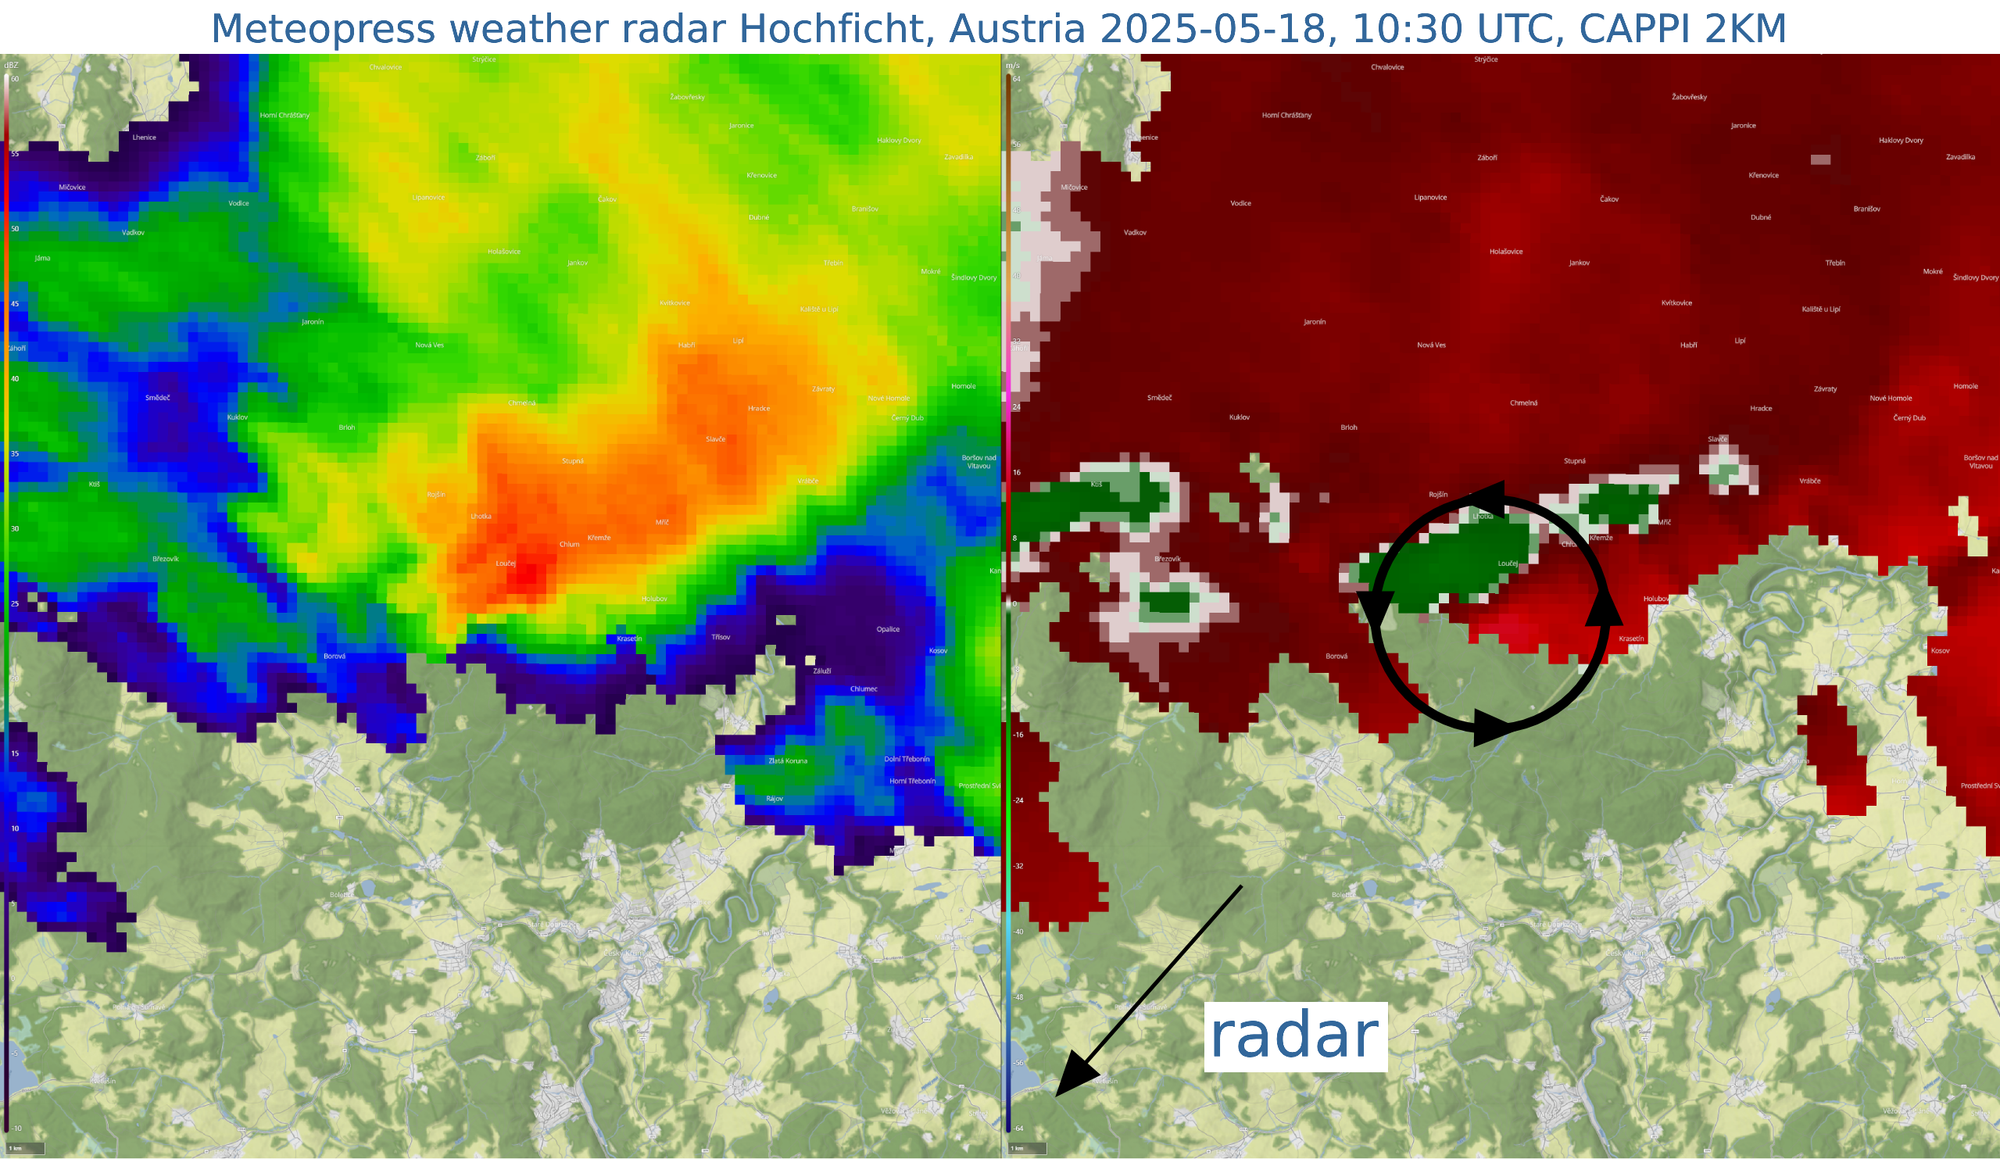
Picture 2: Shower with mesocyclone and hook echo 15 minutes before the tornado. May 18, 2025, 10:30 AM UTC, 2 km CAPPI, Hochficht radar. Radar reflectivity (left), radial velocity (right).
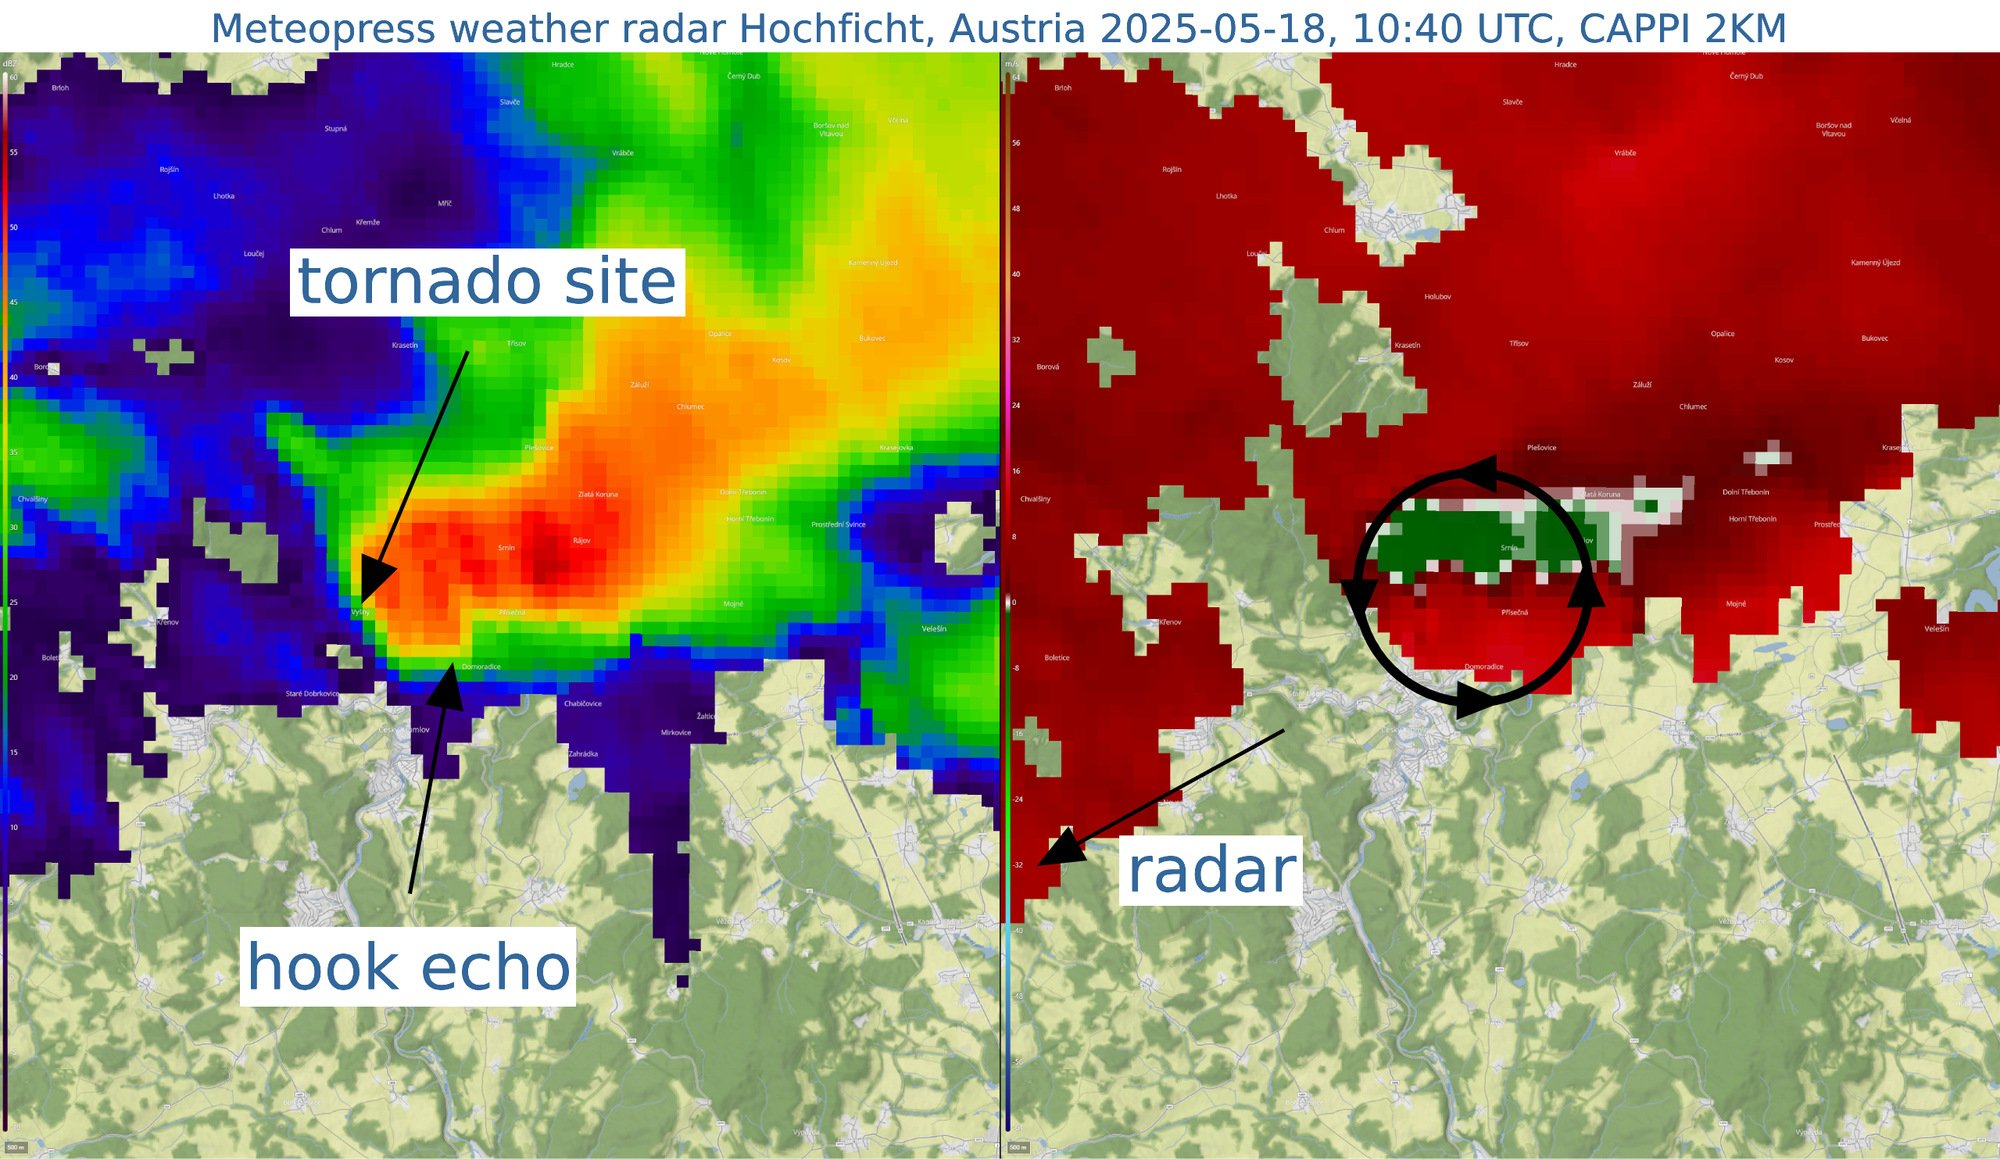
Picture 3: Shower with mesocyclone and hook echo approximately at the time of the tornado. May 18, 2025, 10:40 AM UTC, 2 km CAPPI, Hochficht radar. Radar reflectivity (left), radial velocity (right).
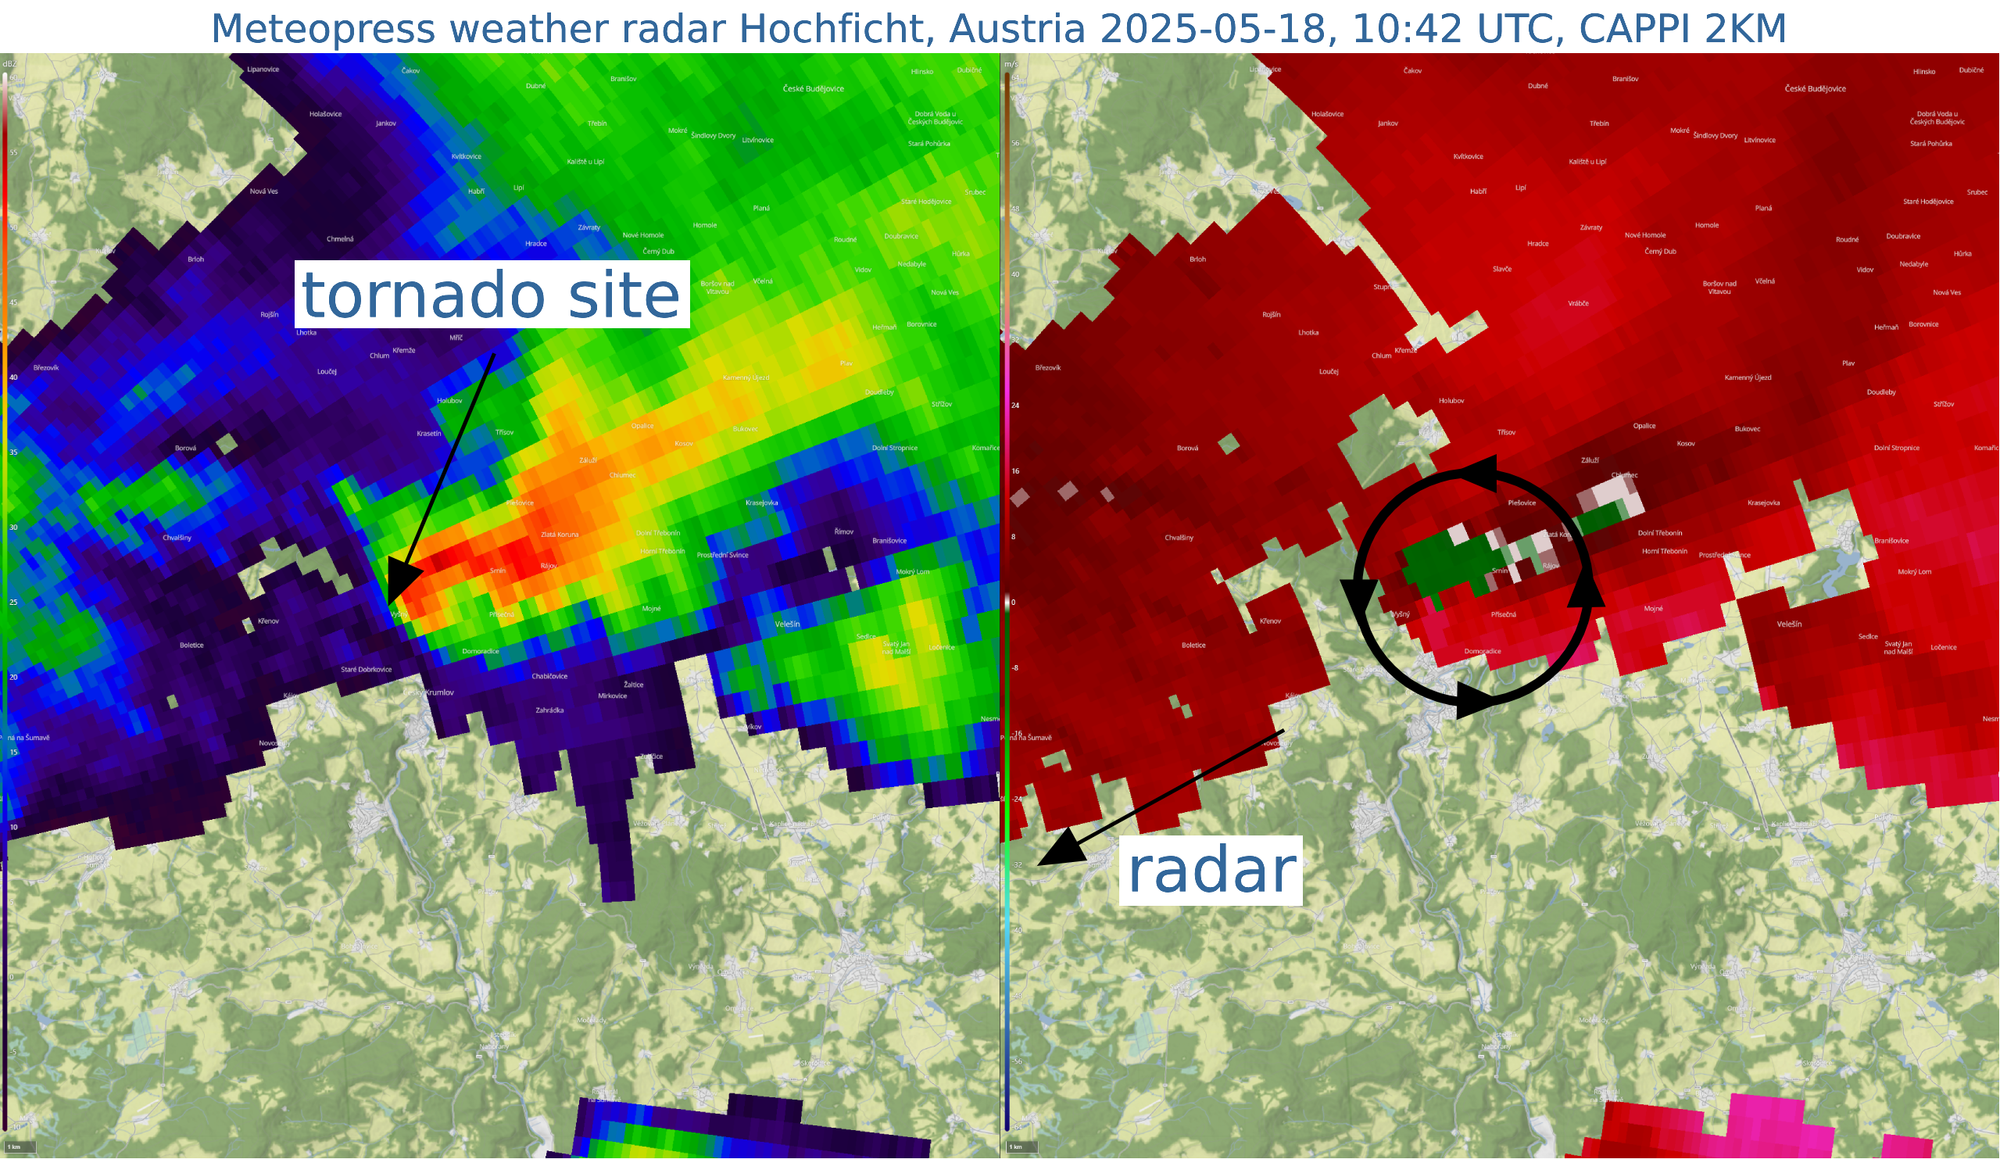
Picture 4: Shower with mesocyclone and hook echo approximately at the time of the tornado. May 18, 2025, 10:42 AM UTC, 1.4° elevation (800 m above radar, 30 km distance), Hochficht radar. Radar reflectivity (left), radial velocity (right).
Correlation coefficient and differential reflectivity correspond to snow precipitation at this height.
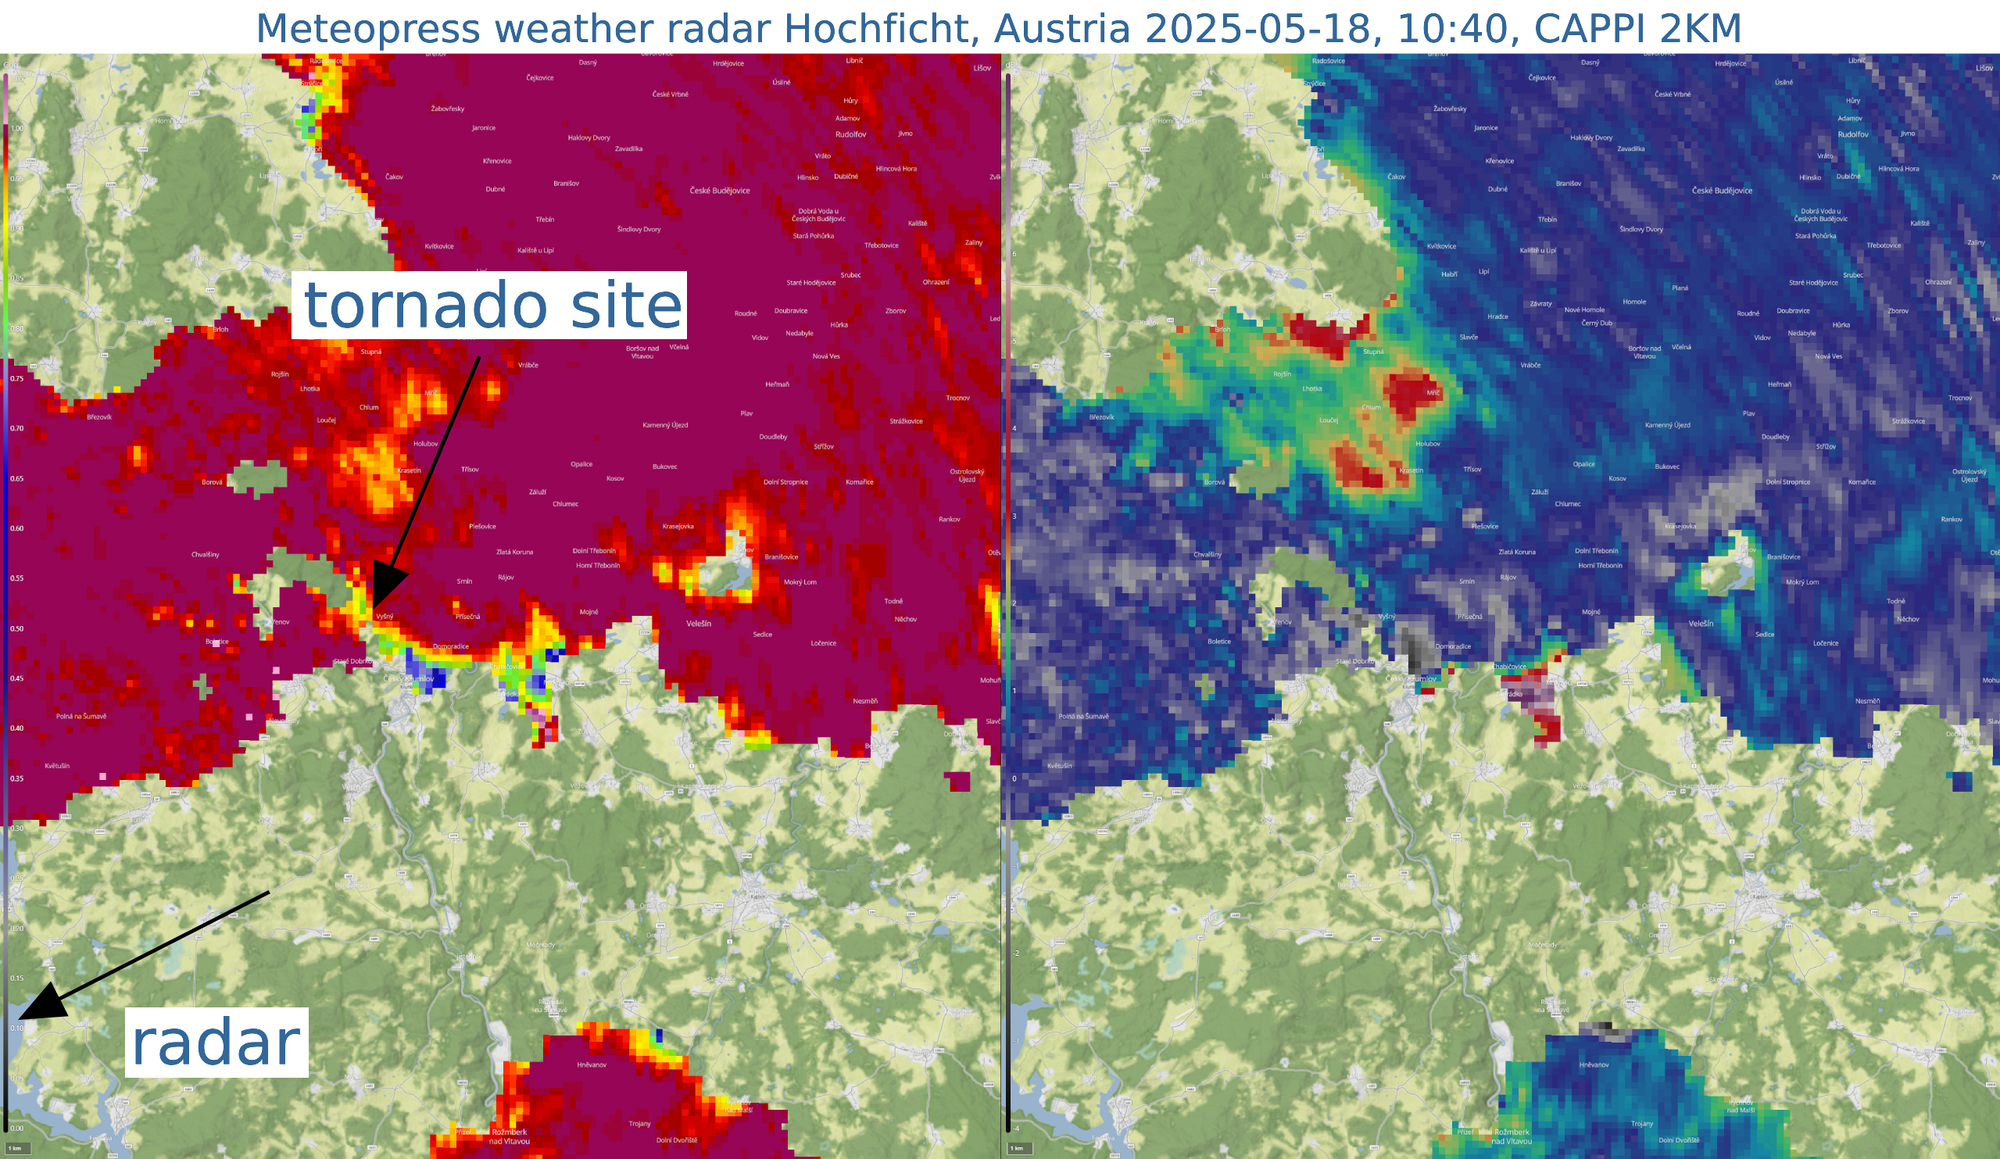
Picture 5: Shower approximately at the time of the tornado. May 18, 2025, 10:42 AM UTC, 1.4° elevation (800 m above radar, 30 km distance), Hochficht radar. Correlation coefficient (left), differential reflectivity (right).
Brdy radar
The shower was also captured by the Brdy weather radar (916 m ASL, operated by CHMI), located approximately 100 kilometers northwest of the tornado site. Although the shower is visible in this data as well, due to the greater distance from the event and a less favorable radar position relative to the storm’s path, signs of rotation were not as distinct in either reflectivity or Doppler velocity. A significant role is also played by the different radar signal postprocessing and scanning strategy of this radar, resulting in stronger filtering of meteorological targets and a lower maximum detectable Doppler velocity.
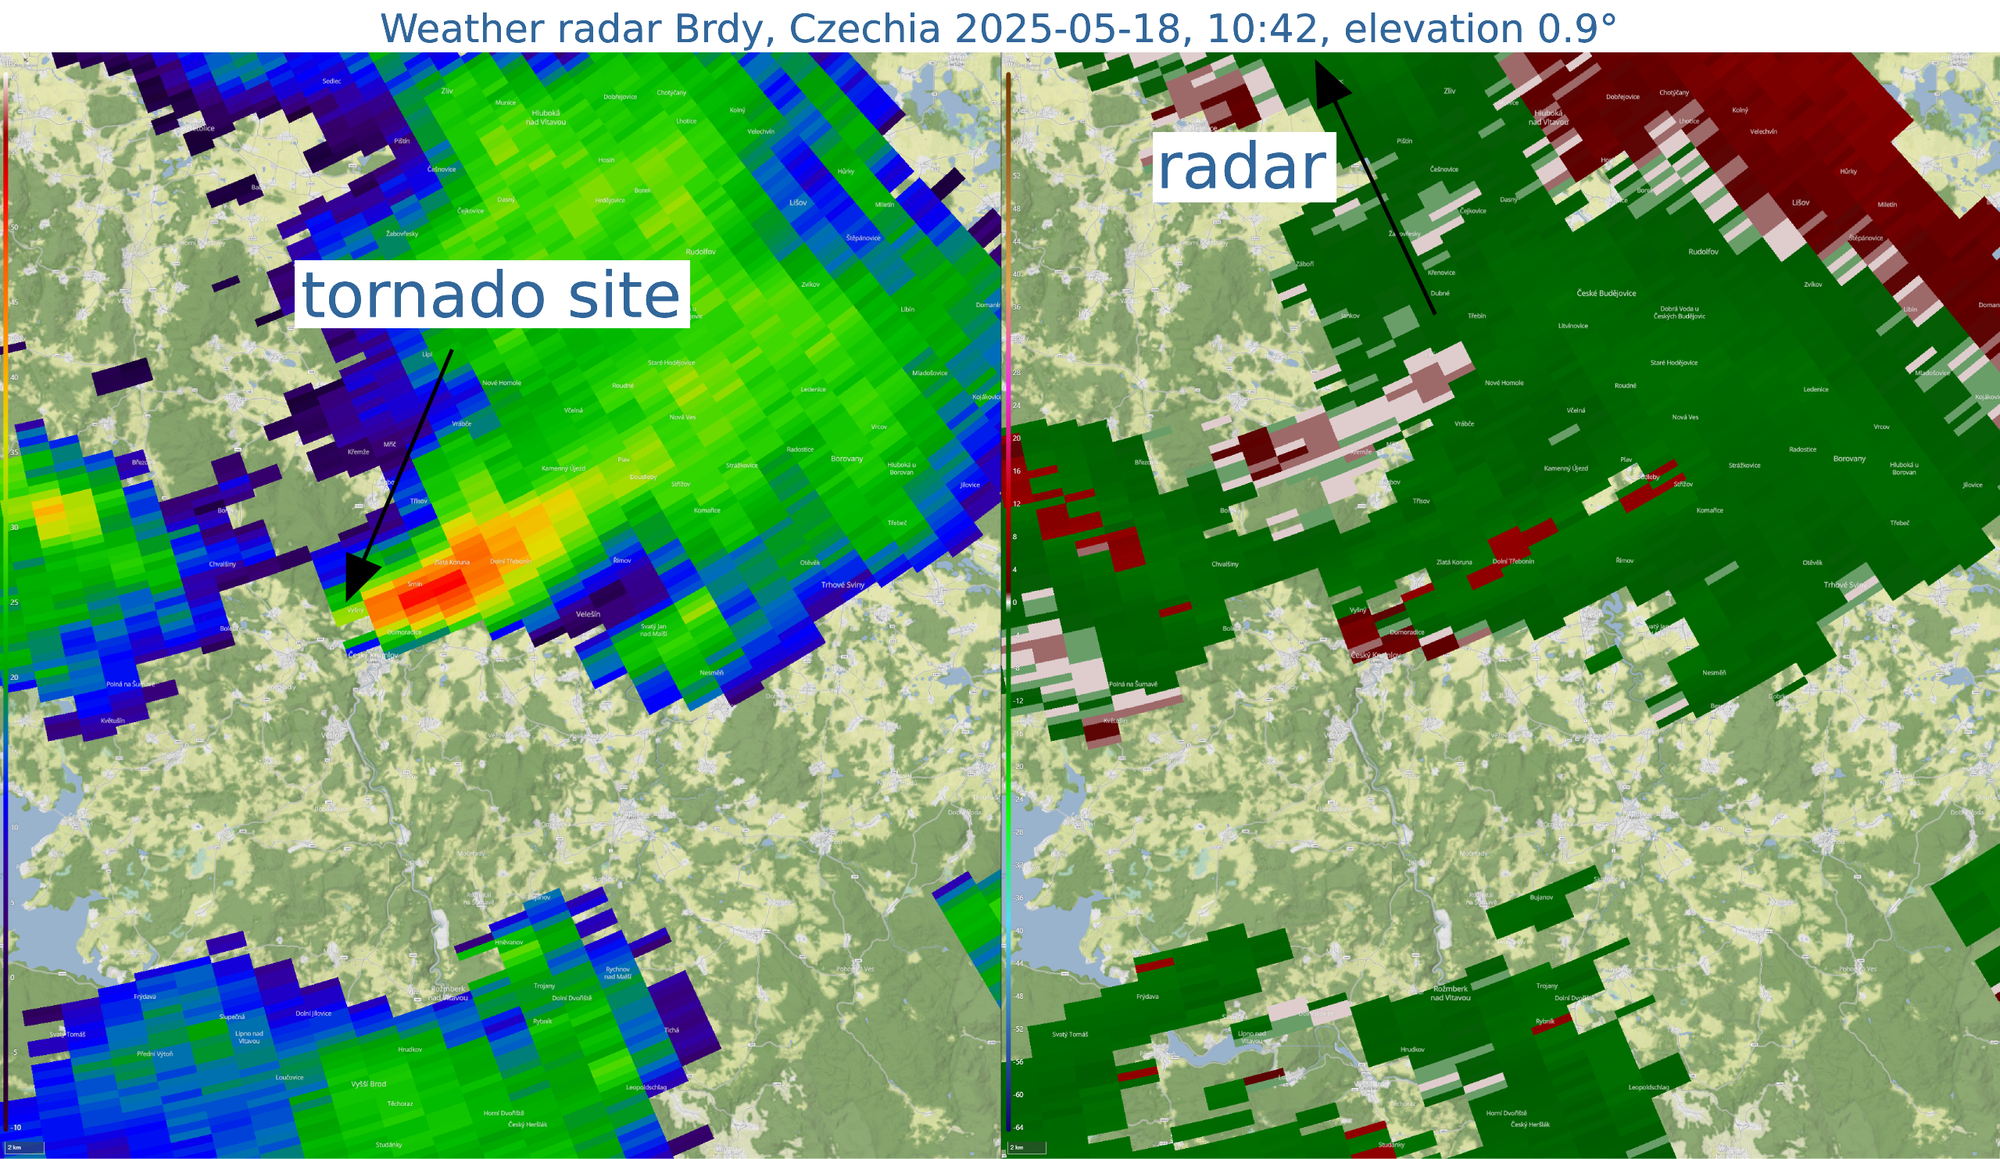
Picture 6: Shower approximately at the time of the tornado. May 18, 2025, 10:42 AM UTC, 0.9° elevation (2150 m above radar, 100 km distance), Brdy radar. Radar reflectivity (left), radial velocity (right).
Comparison
When comparing radar data at approximately the same altitude, it is evident that the Hochficht radar captured the structure and rotation within the shower more effectively, primarily due to its closer proximity and less aggressive data filtering. Rotation is also visible in the Brdy radar data, but due to the lower maximum detectable velocity, aliasing occurs, making rotation harder to identify.
In the case of the correlation coefficient, generally lower values are seen with the Brdy radar, due to different data processing and greater distance. For differential reflectivity, no significant differences between the radars are observed.
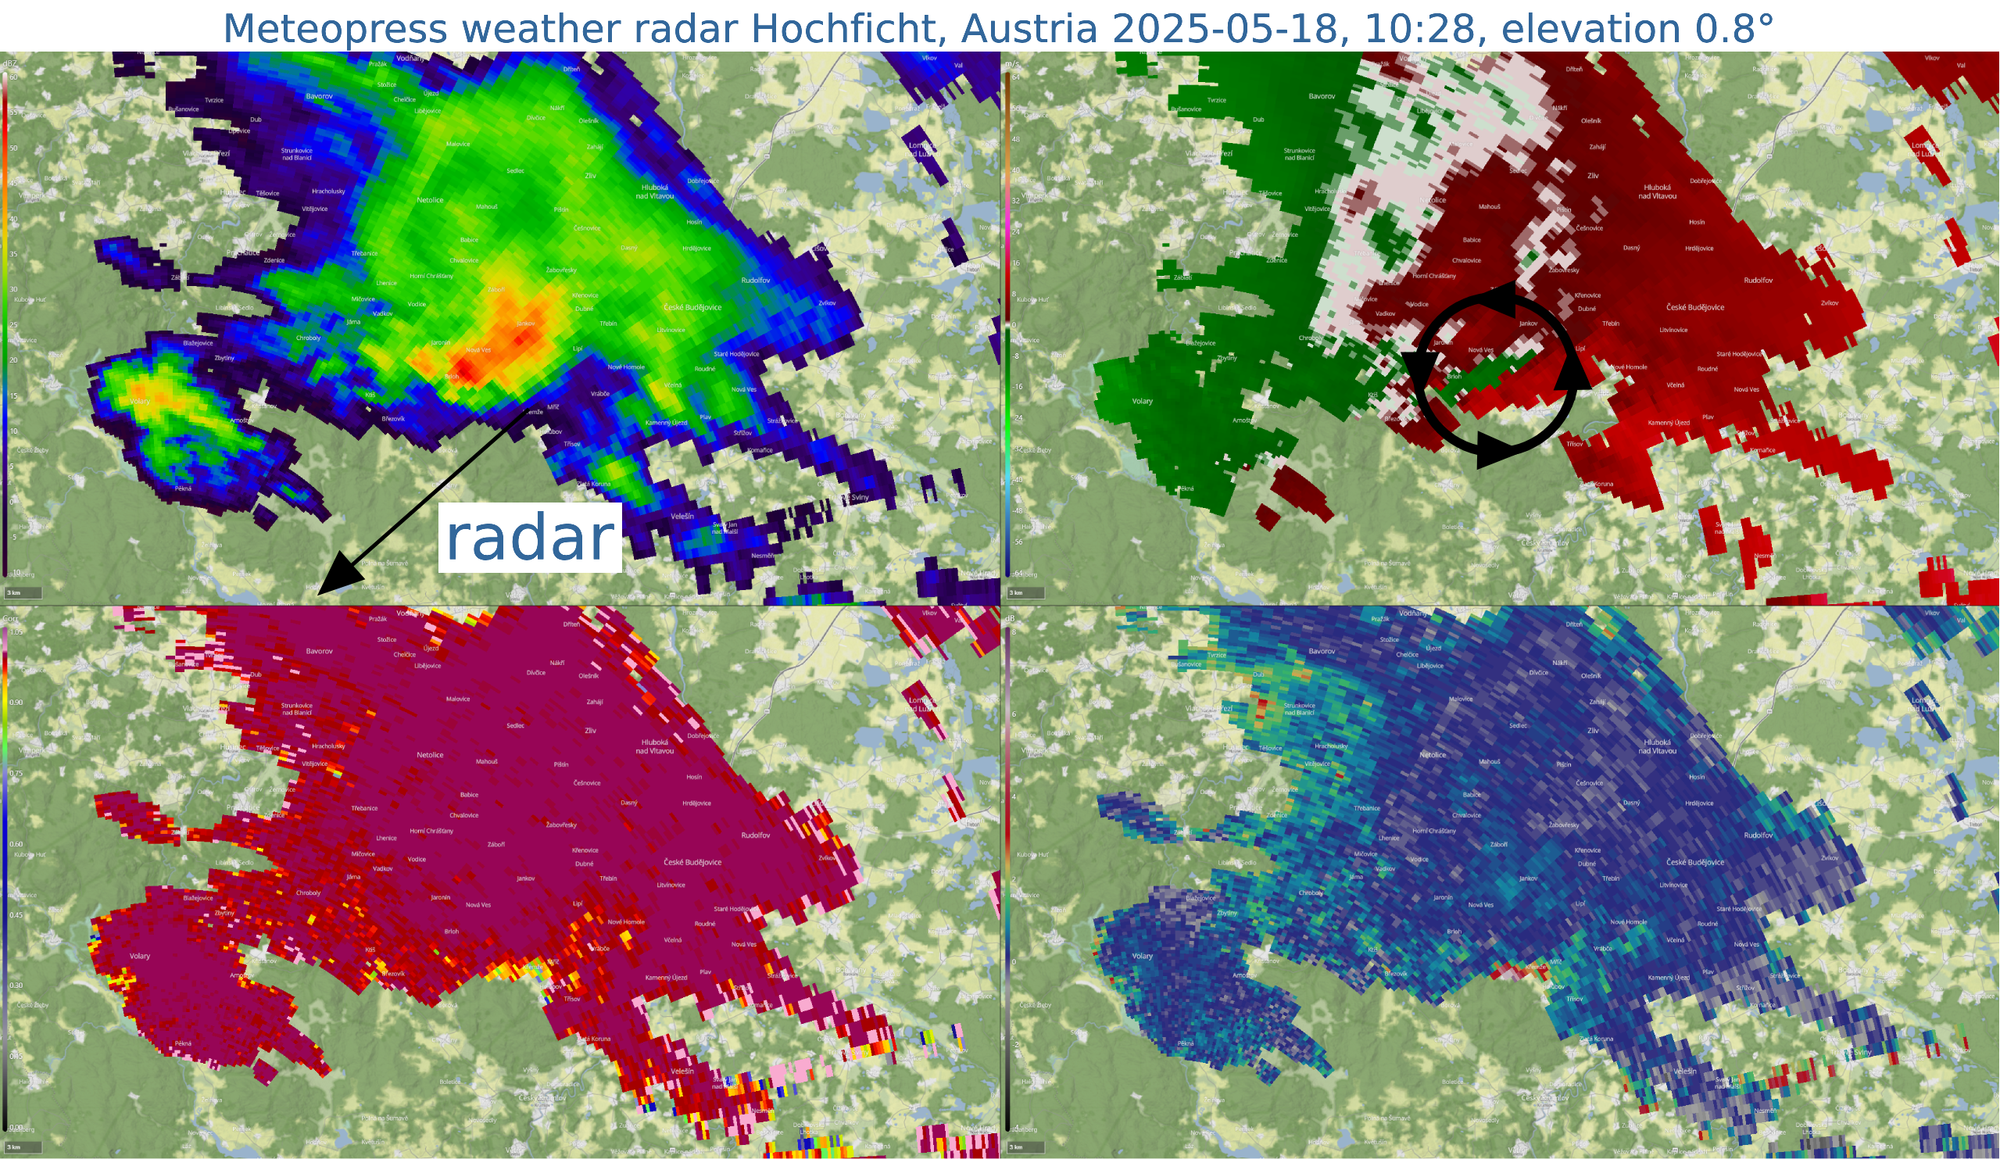
Picture 7: Shower 15 minutes before the tornado. May 18, 2025, 10:28 AM UTC, 0.8° elevation (500 m above radar, 32 km distance), Hochficht radar. Reflectivity (top left), radial velocity (top right), correlation coefficient (bottom left), differential reflectivity (bottom right).
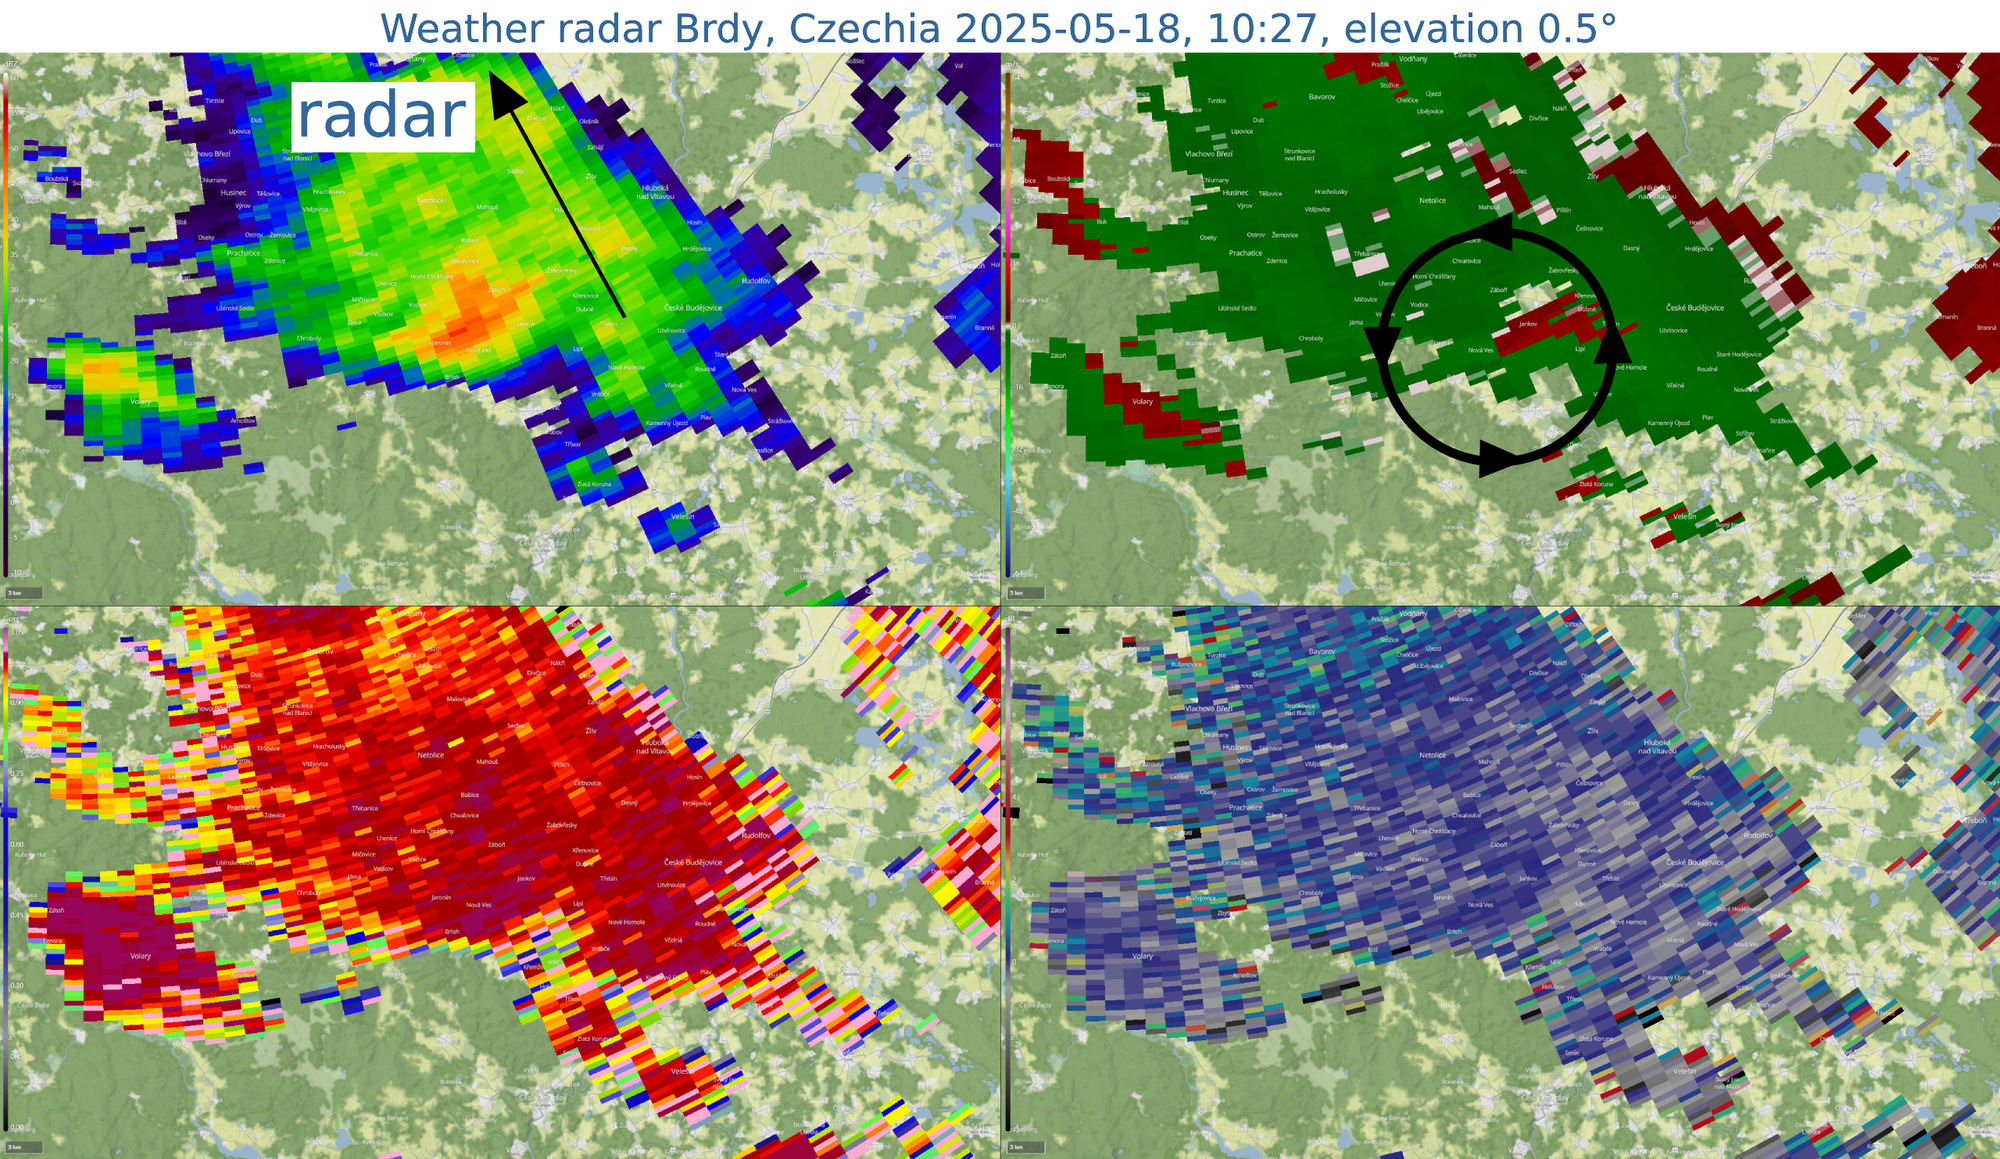
Picture 8: Shower 15 minutes before the tornado. May 18, 2025, 10:27 AM UTC, 0.5° elevation (1200 m above radar, 85 km distance), Brdy radar. Reflectivity (top left), radial velocity (top right), correlation coefficient (bottom left), differential reflectivity (bottom right).